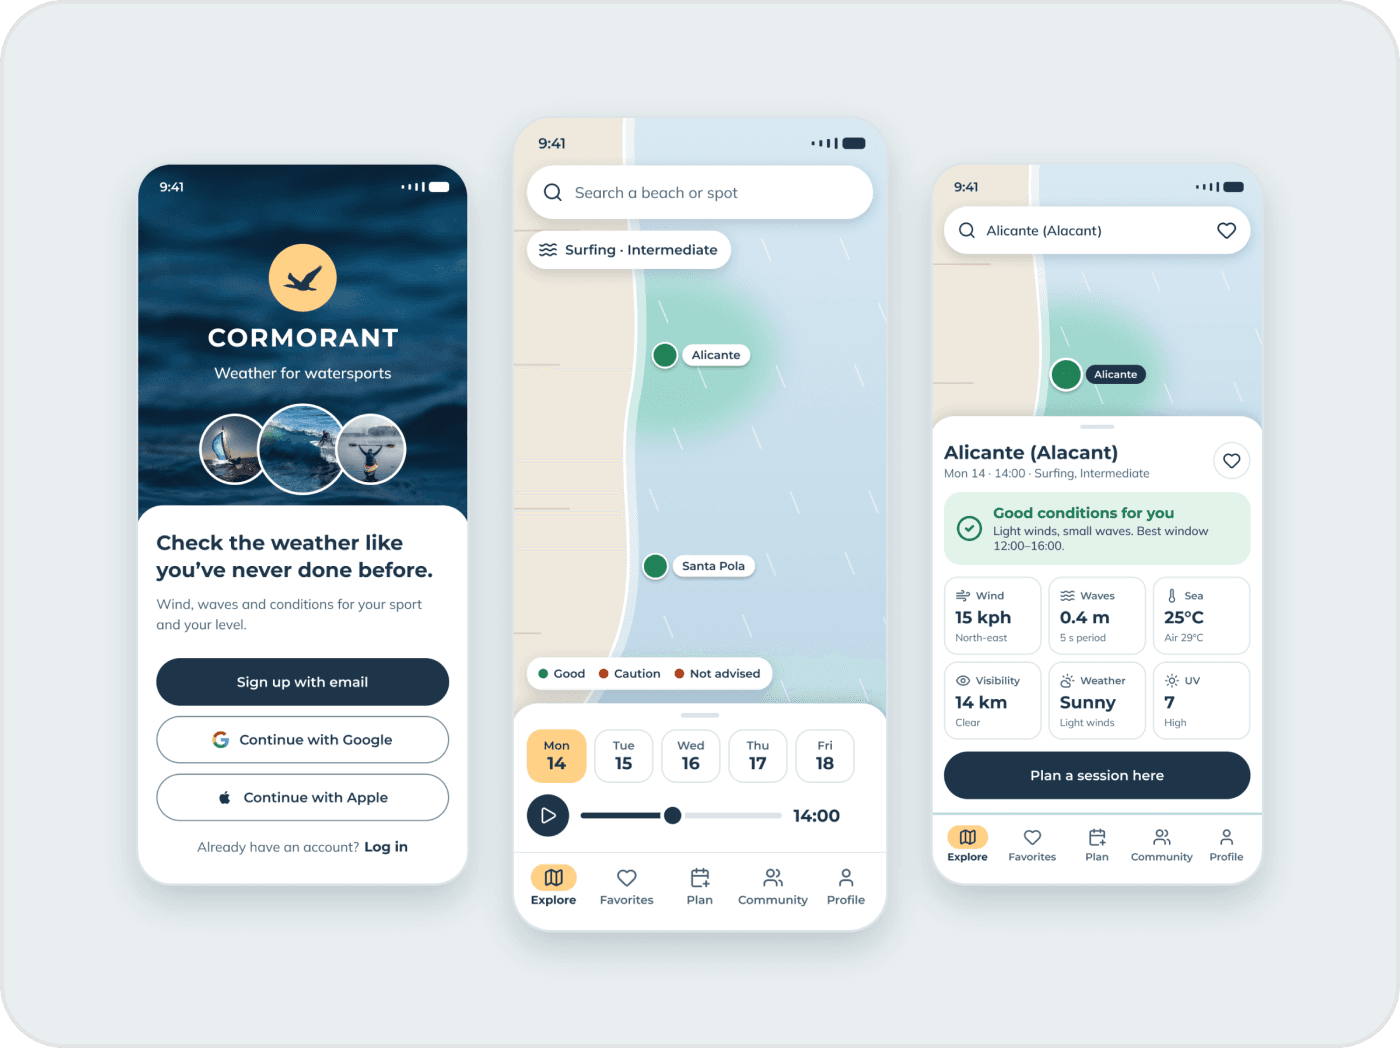
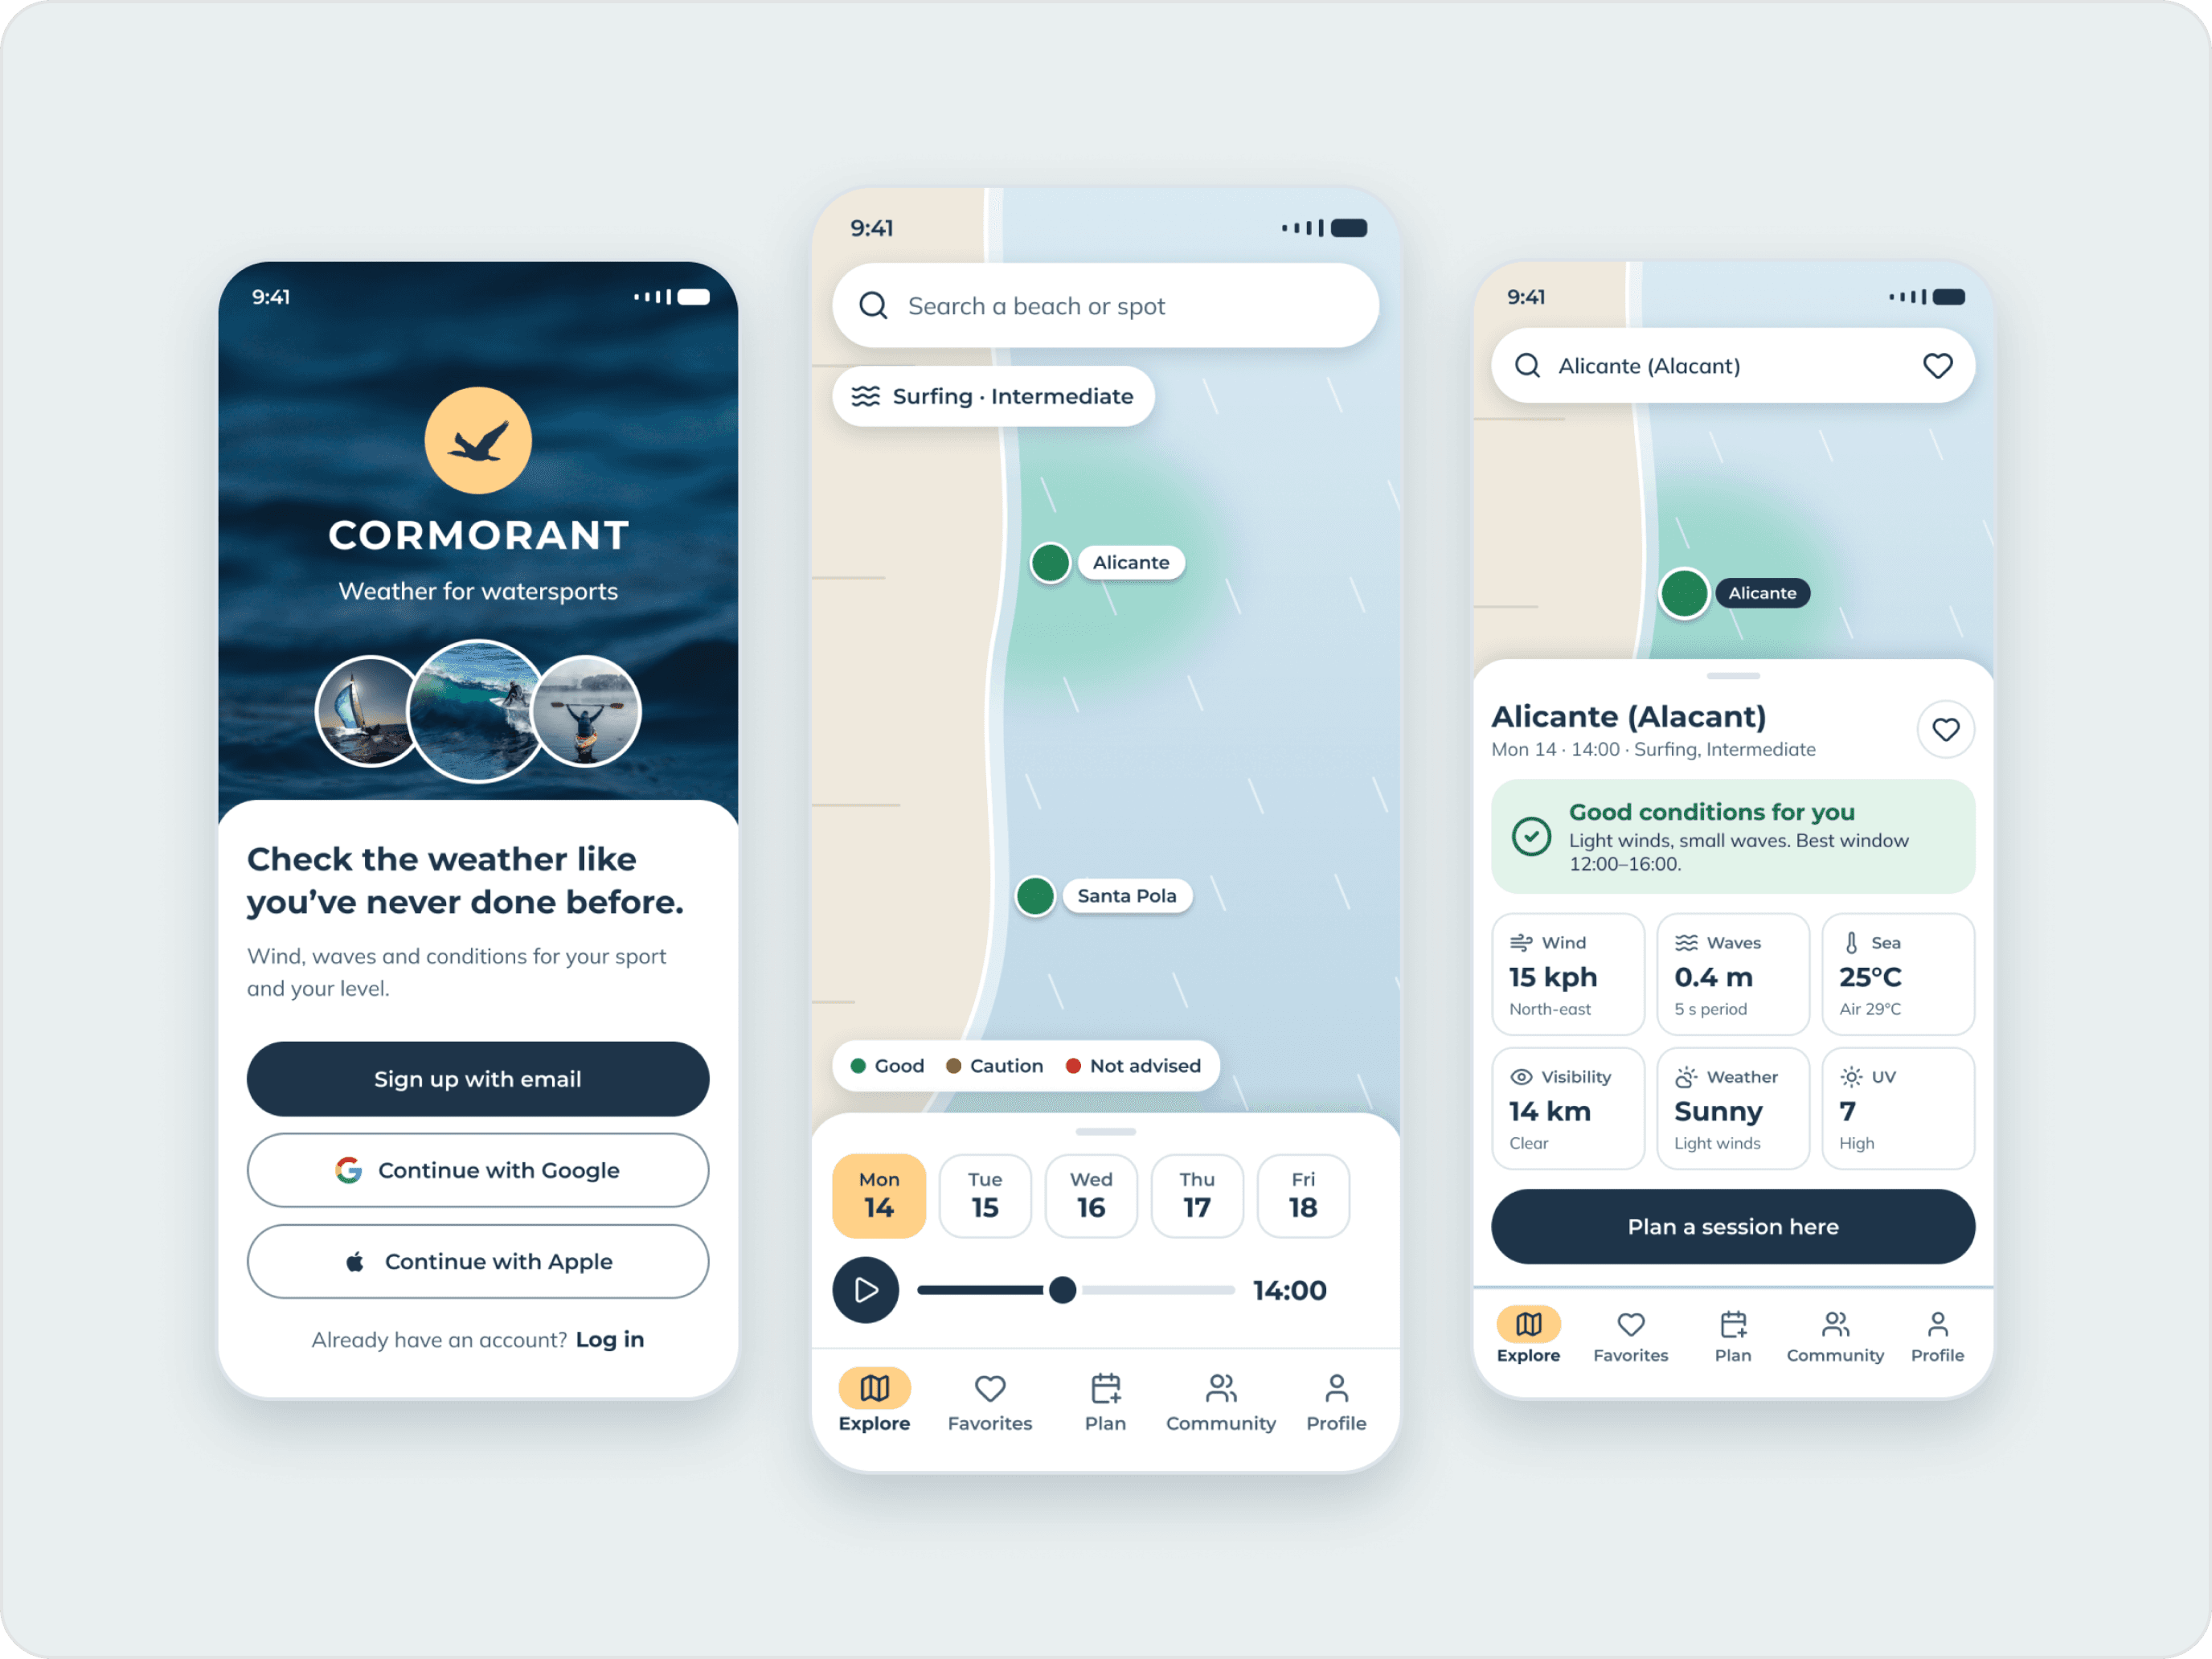
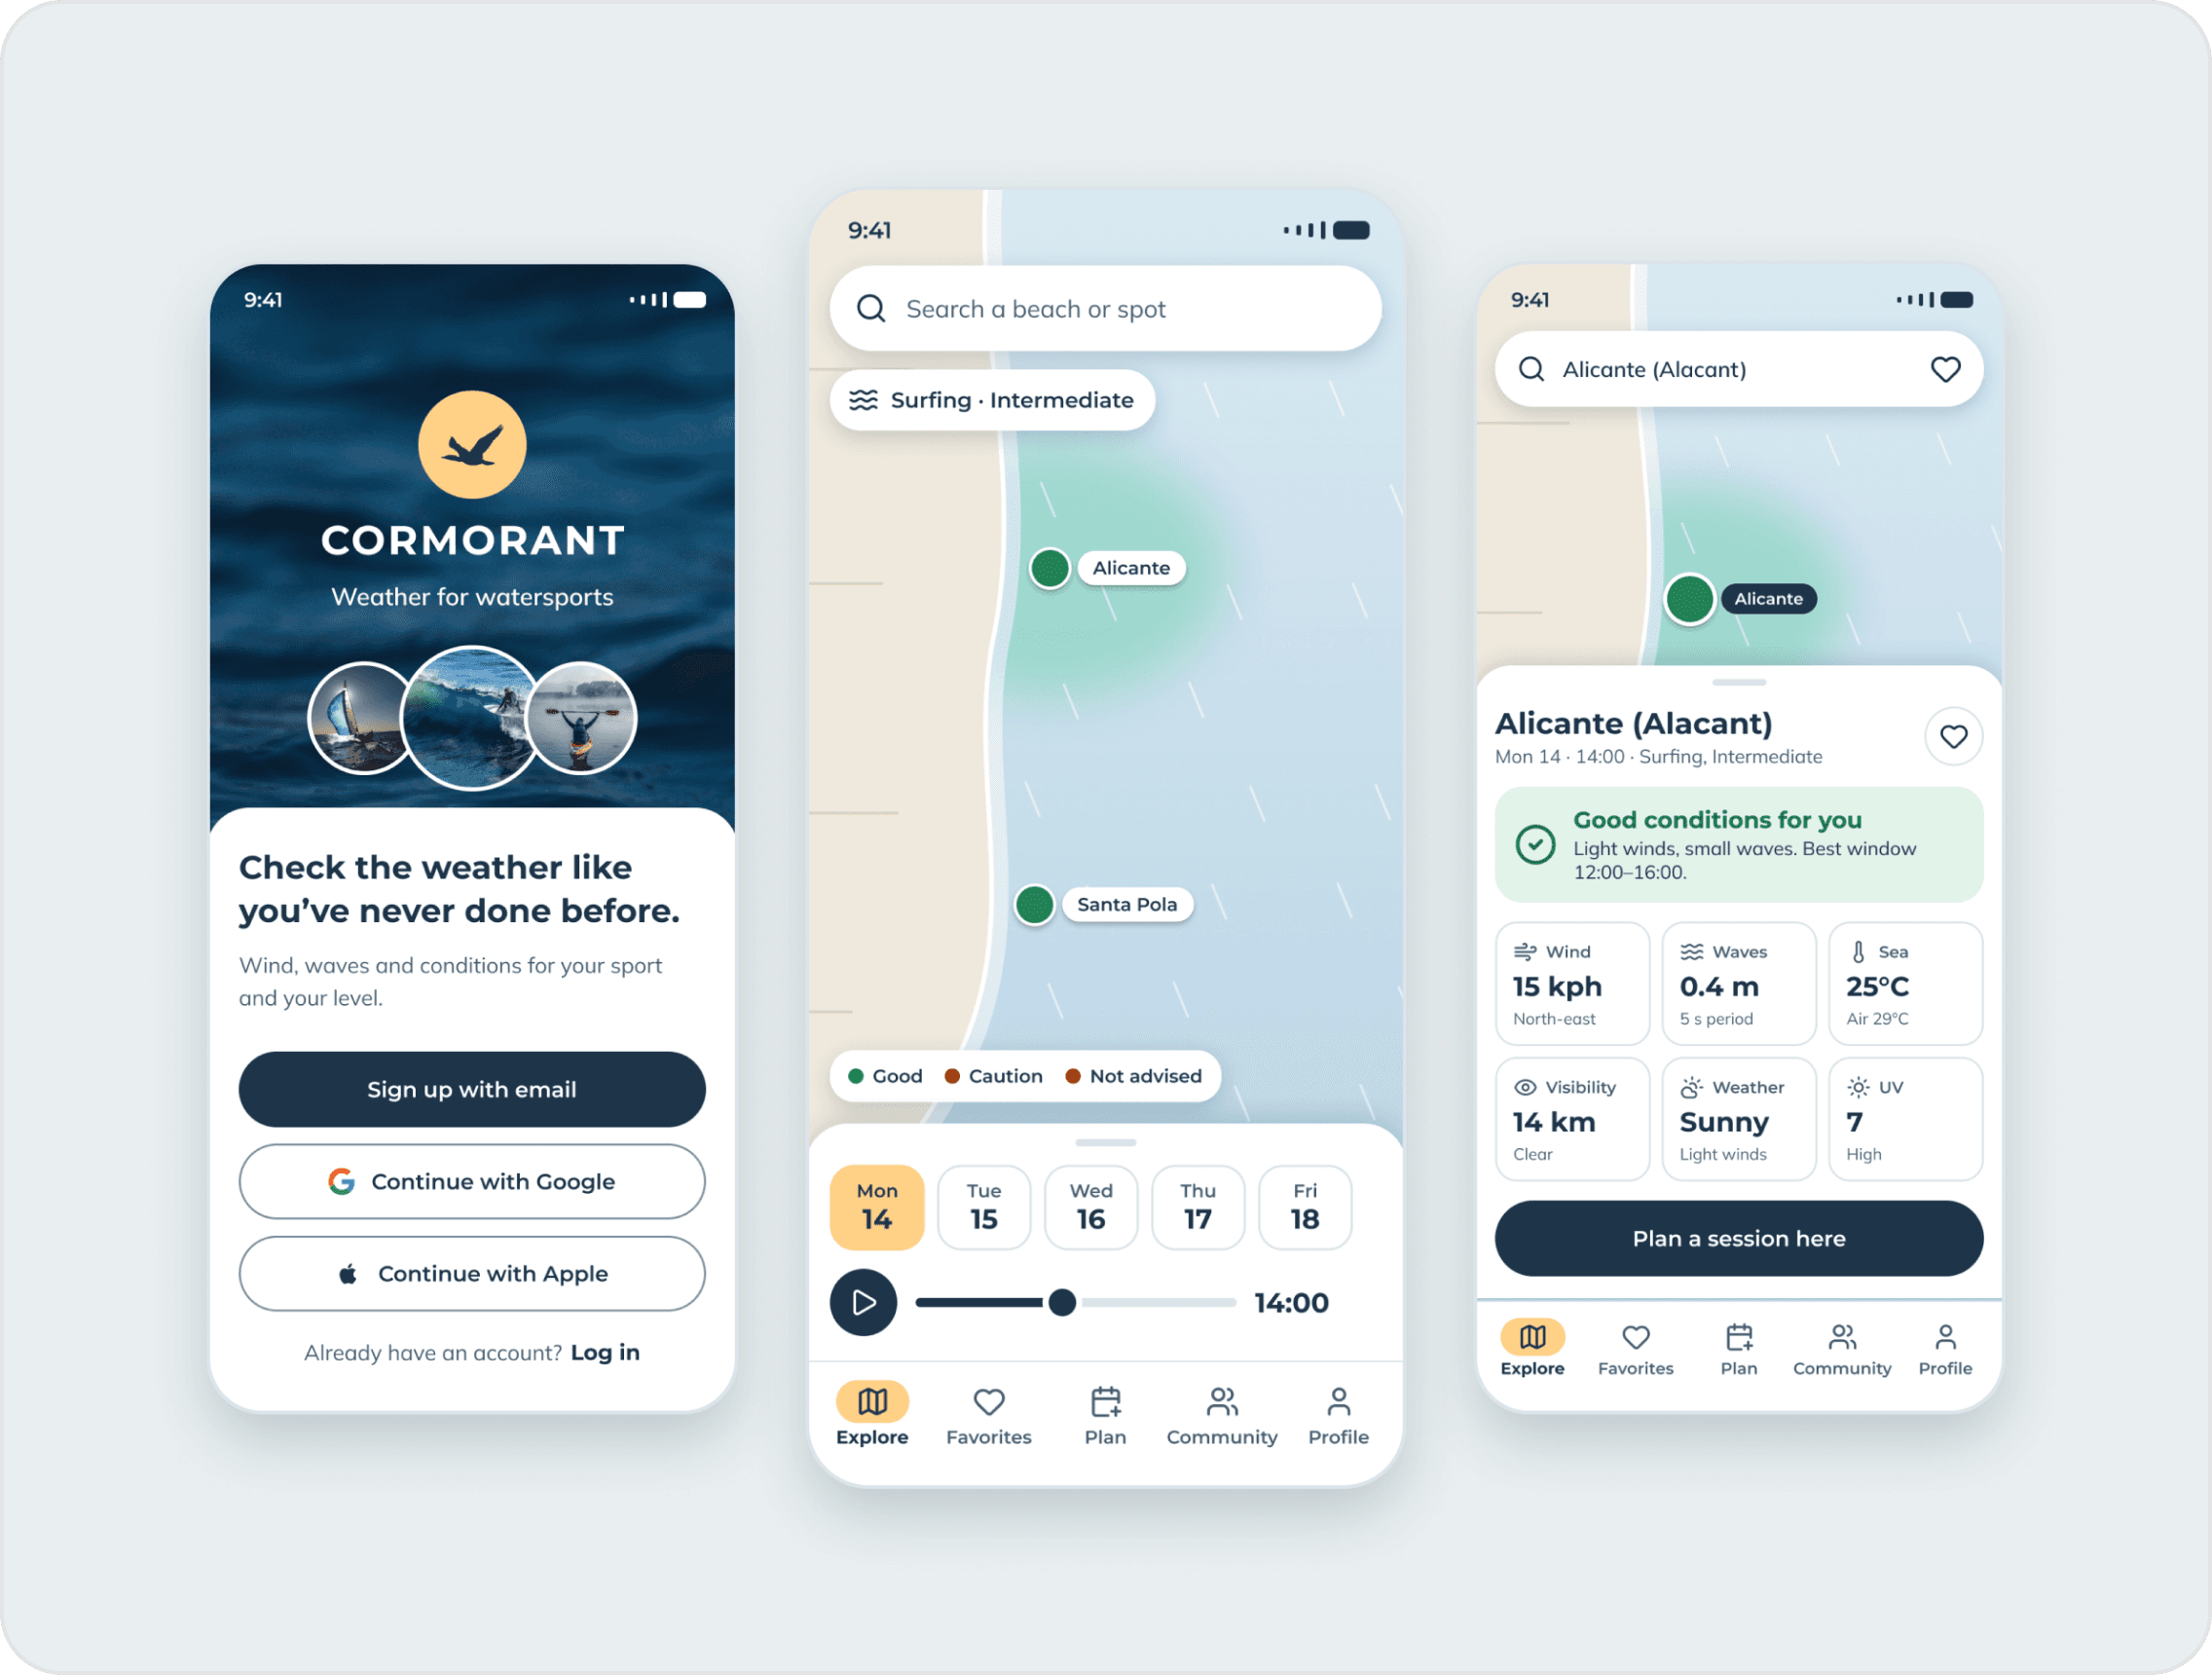
TL;DR
Cormorant is a weather app for sailors, surfers, swimmers and other watersports fans. I took it from competitor analysis and interviews to a tested prototype as a course project, then came back to audit the interface and redesign its key screens around what the research and the tests had already shown.
- Interviews with watersports users of different levels
- 5
- Usability testers who shaped the final design
- 6
- People in the preference test that guided the visual direction
- 12
Overview
A weather app people can read at a glance
Cormorant gives sailors, surfers, divers and other watersports fans simple, readable reports on wind, waves and weather. I ran the project end to end as part of the CareerFoundry UX Immersion course, with regular check-ins with a mentor from the industry who helped me think through, understand and improve every exercise. Later I revisited it with fresh eyes, audited the interface and redesigned the key screens.
Problem
Watersports fans need to understand the forecast.
Water sports enthusiasts need a way to easily check and understand the weather forecast to avoid dangerous situations and enjoy their journey.
Objective
Beautiful, easy-to-read reports.
Provide beautifully displayed, easy-to-understand wind, wave and weather reports and forecasts for sailors, surfers, divers and any other water sport aficionado.
Skills
Research, testing and UI craft.
Competitor analysis, user interviews, affinity mapping, personas, card sorting, information architecture, wireframing, prototyping, usability and preference testing, UI design and a design language system.
Process
A human-centred, iterative process
The project followed a framework based on Design Thinking and Human-Centered Design. Because the process is iterative, I went back and forth between the steps to make sure every design decision was based on research and analysis.
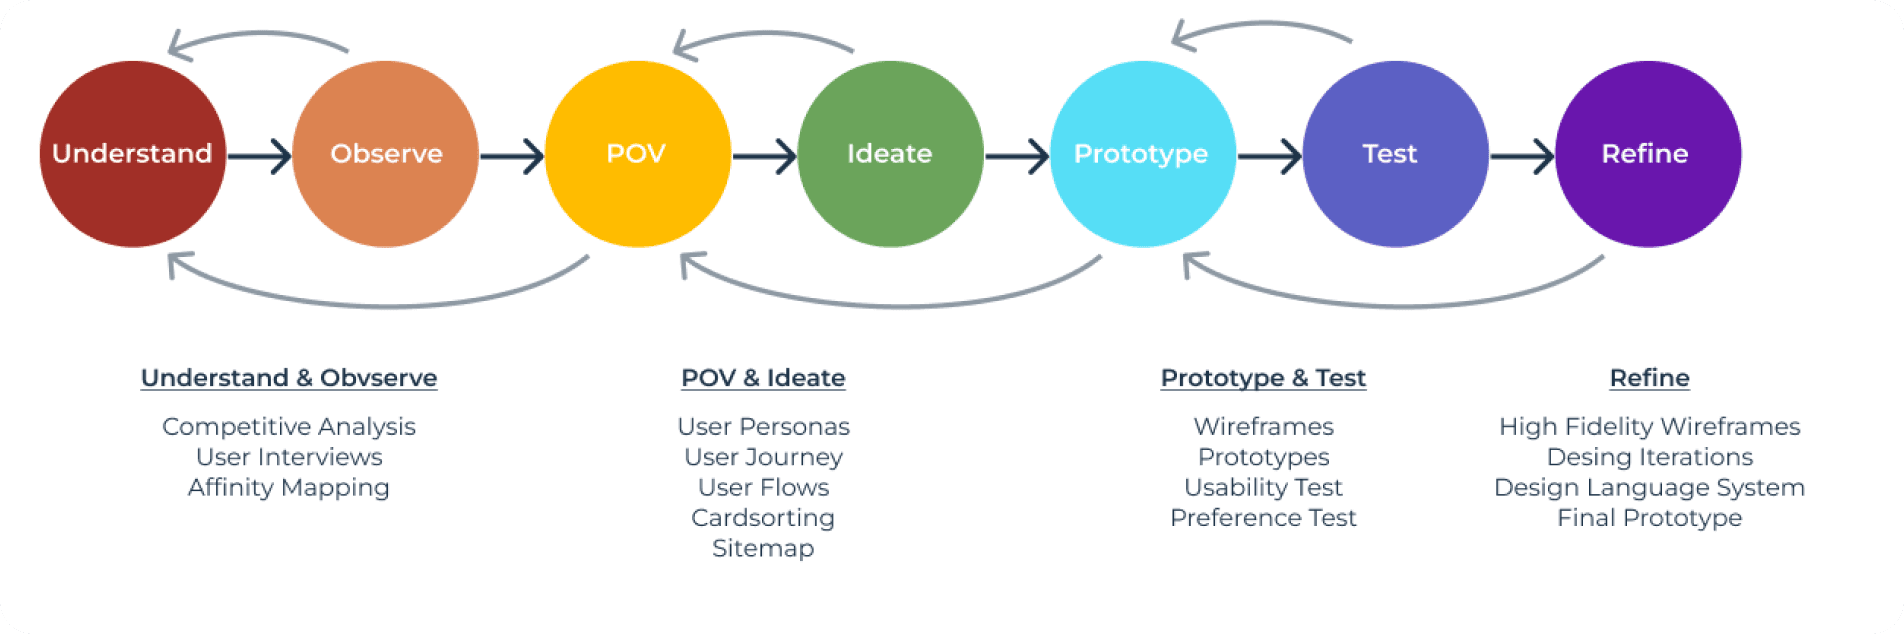
From understanding to refining
Methods grouped by phase of the process.
Understand
Competitor analysis
I analysed windguru.cz and windy.com with SWOT profiles, plus a UX analysis of windy.com, to learn what issues users run into with competitors’ products and where unmet needs remain.
Takeaway
Neither guides new users.
Both are trusted and cover the whole world, but neither offers an onboarding, and both are hard to read for non-experts.
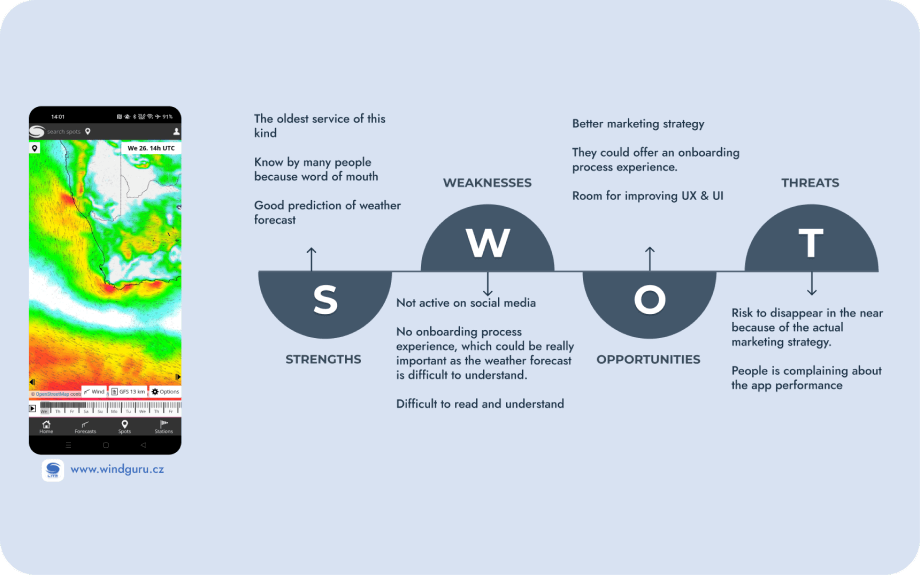
windguru.cz
SWOT profile of the oldest service.
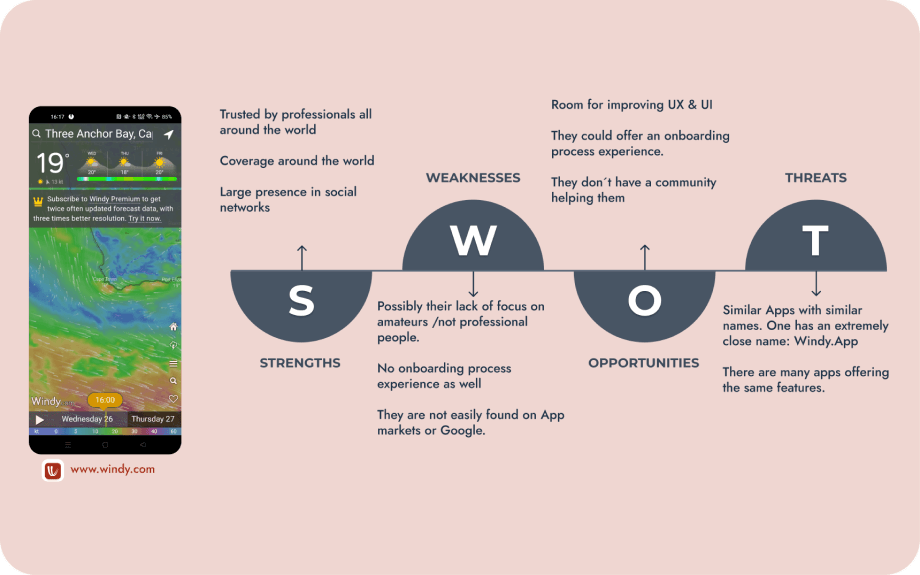
windy.com
SWOT profile of a trusted global service.
User interviews
After setting the research goals, I interviewed five water sports aficionados with different levels of experience, in person and remotely. I then organised and analysed what they said with affinity mapping.
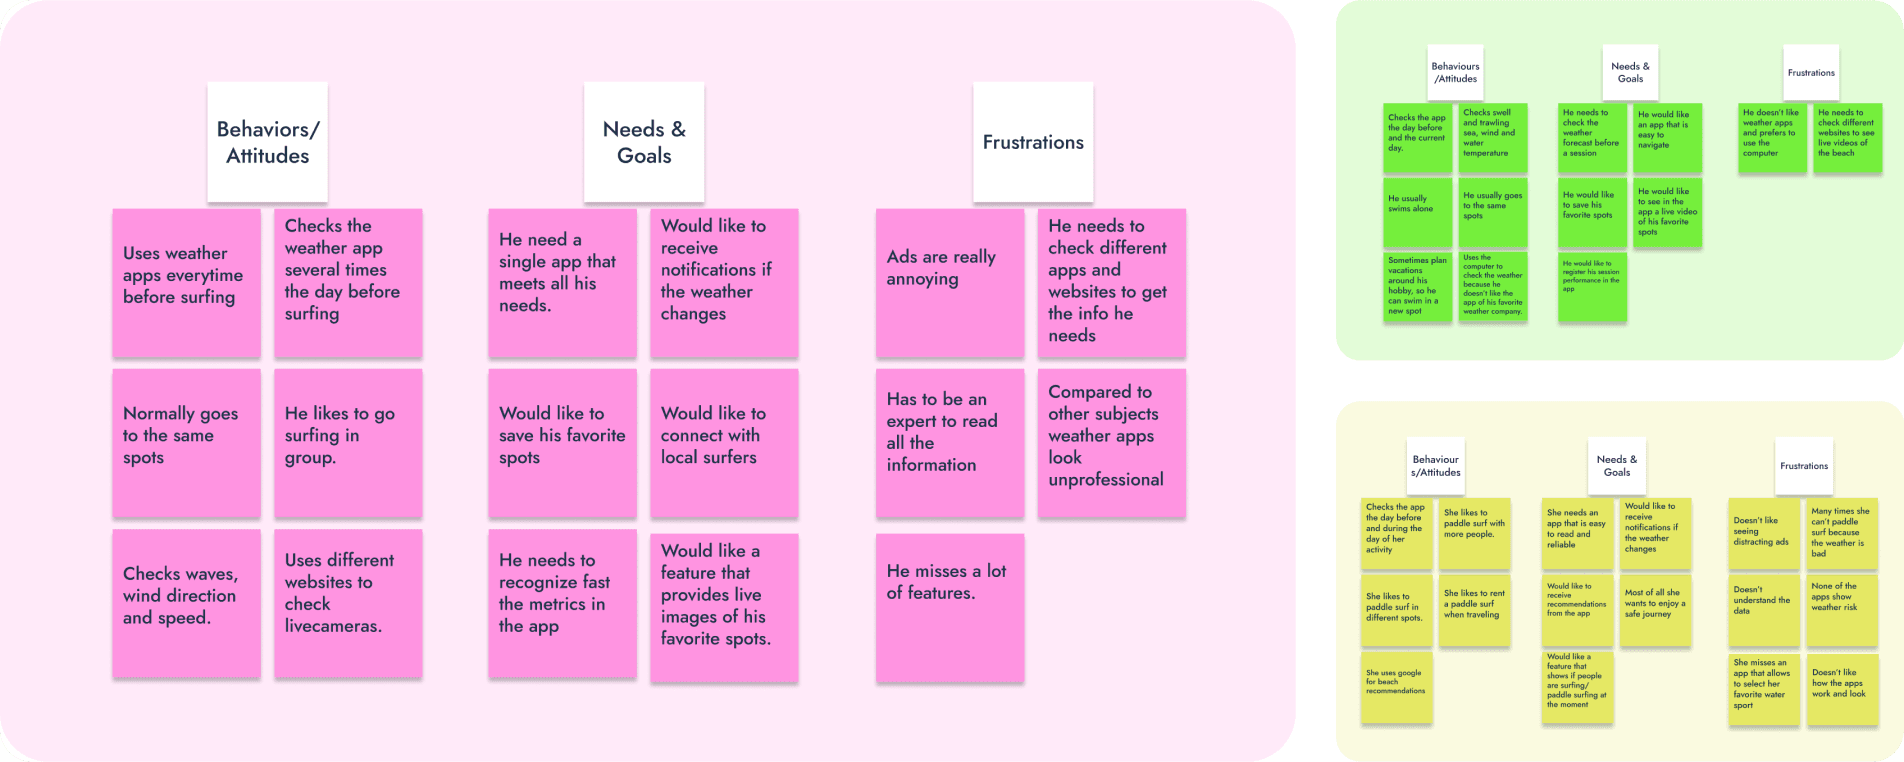
Notes from the interviews
A sample of the behaviours, needs and frustrations participants shared.
Affinity mapping and insights
I created an affinity map to organise my findings and identify key statements and challenges.
Habits
Everyone checks, nobody trusts a single source.
All users check the app the day before and on the day, and some use more than one app. Metrics are poorly displayed: they feel they need to be an expert to read them.
Wish list
What they asked for.
To save favourite spots, get notifications when the weather changes, see live video before going and filter by water sport. They dislike ads, especially unrelated ones.
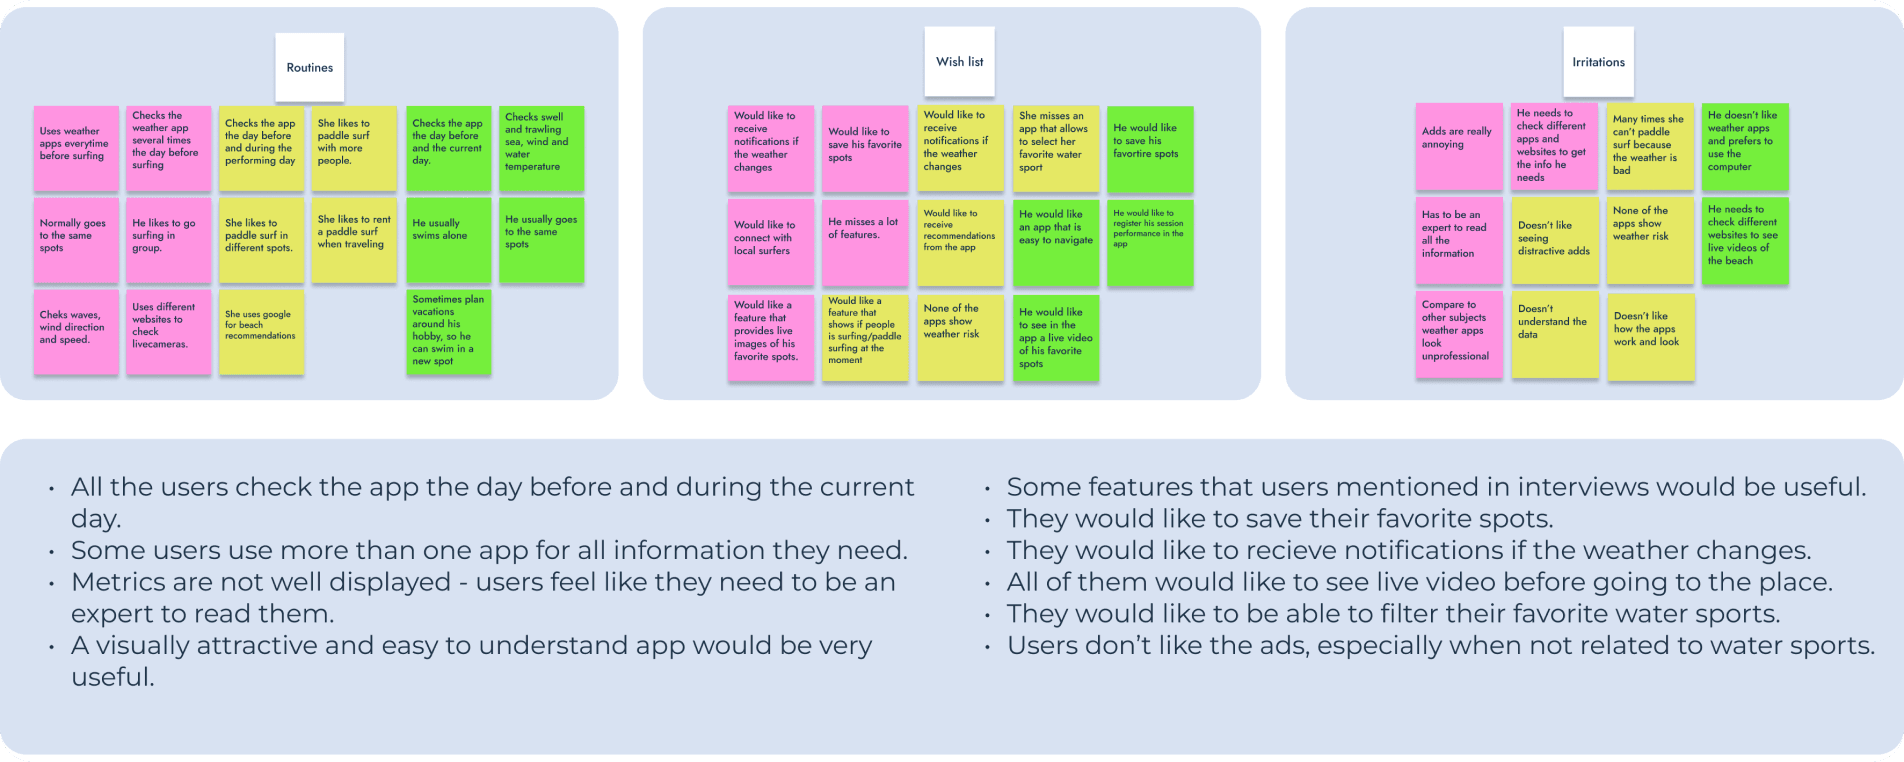
Affinity map and insights
Routines, wish list and irritations, and what I drew from them.
Define and ideate
User personas
After analysing the interviews I identified two major groups of users: beginner and expert water sports aficionados. The personas are 100% based on the participants and helped me decide which features to prioritise.
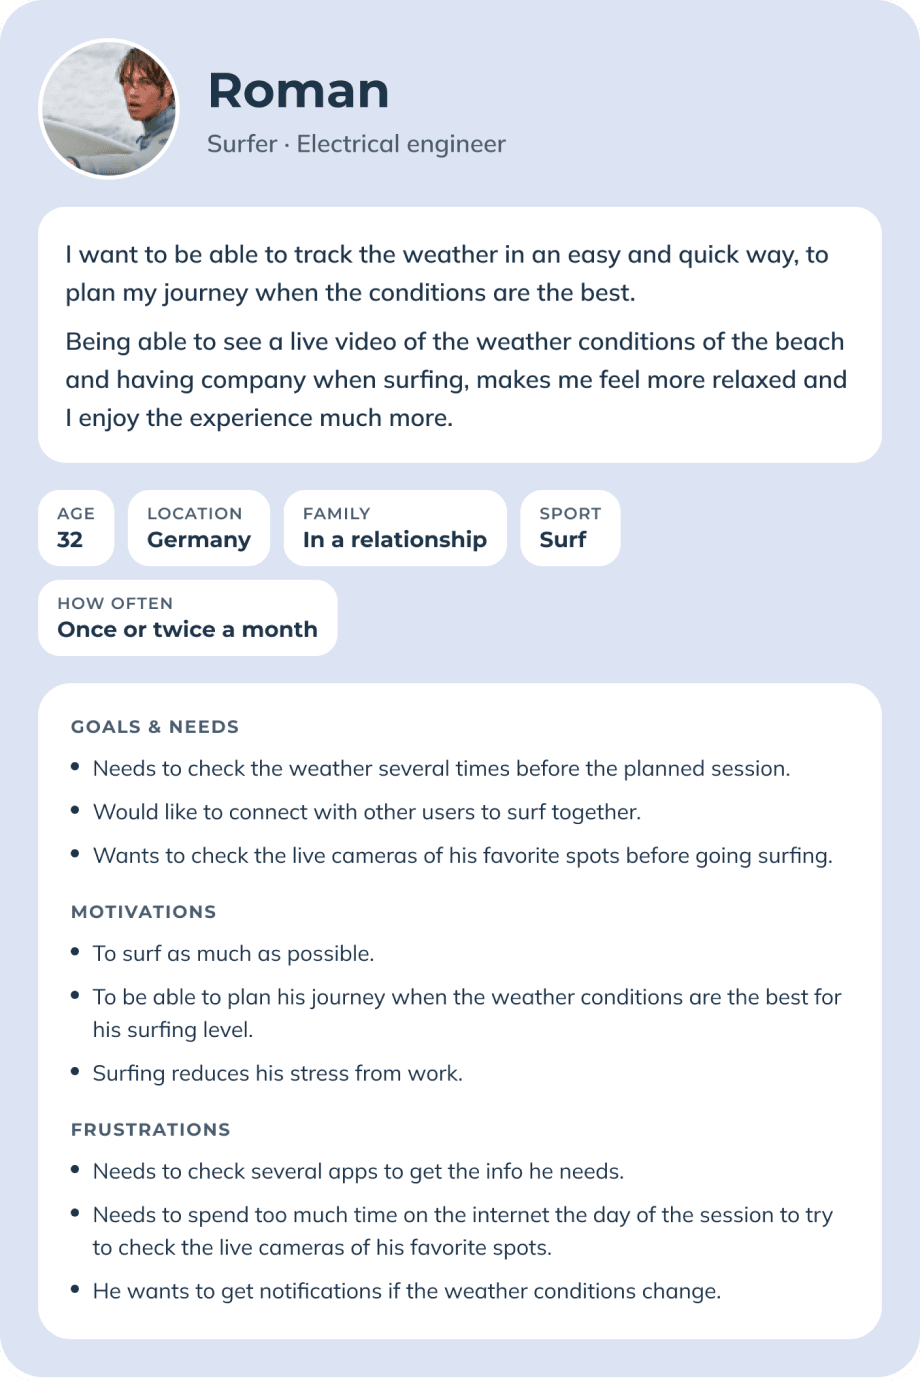
Roman, 32
A surfer from Germany who plans around his level and likes to surf with company.
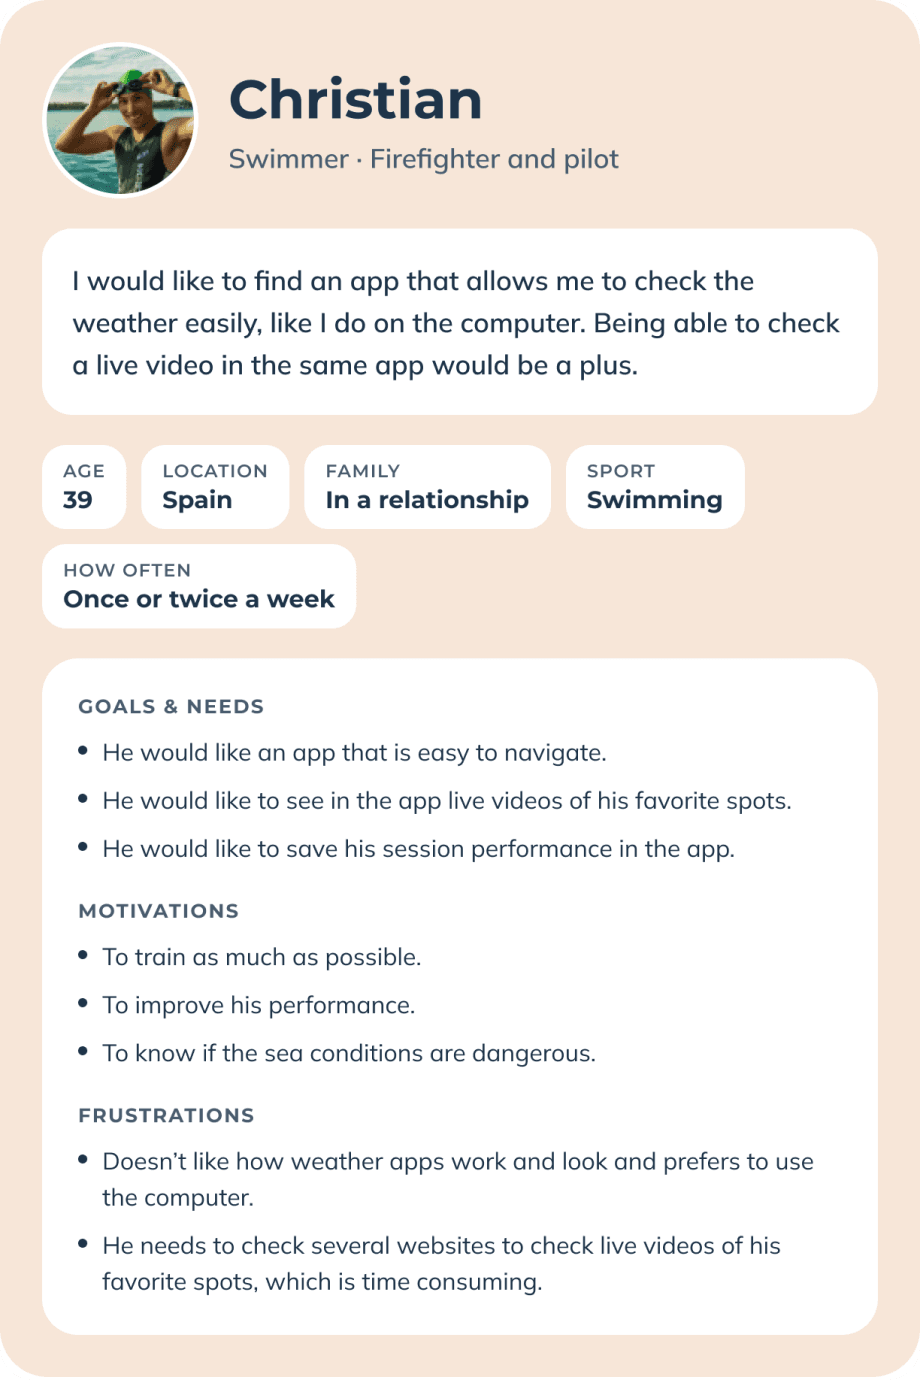
Christian, 39
A swimmer from Spain who needs stable sea conditions for his training.
User journeys
To understand how each persona would interact with the app, I created journeys that simulate their needs, emotions and thoughts. Putting myself in their shoes let me spot gaps in the functionality and the flow.
Opportunities
Design for the level, not for the expert.
Colour-coded conditions on the map by skill level, alerts when conditions change, and saved details so returning users can skip steps.
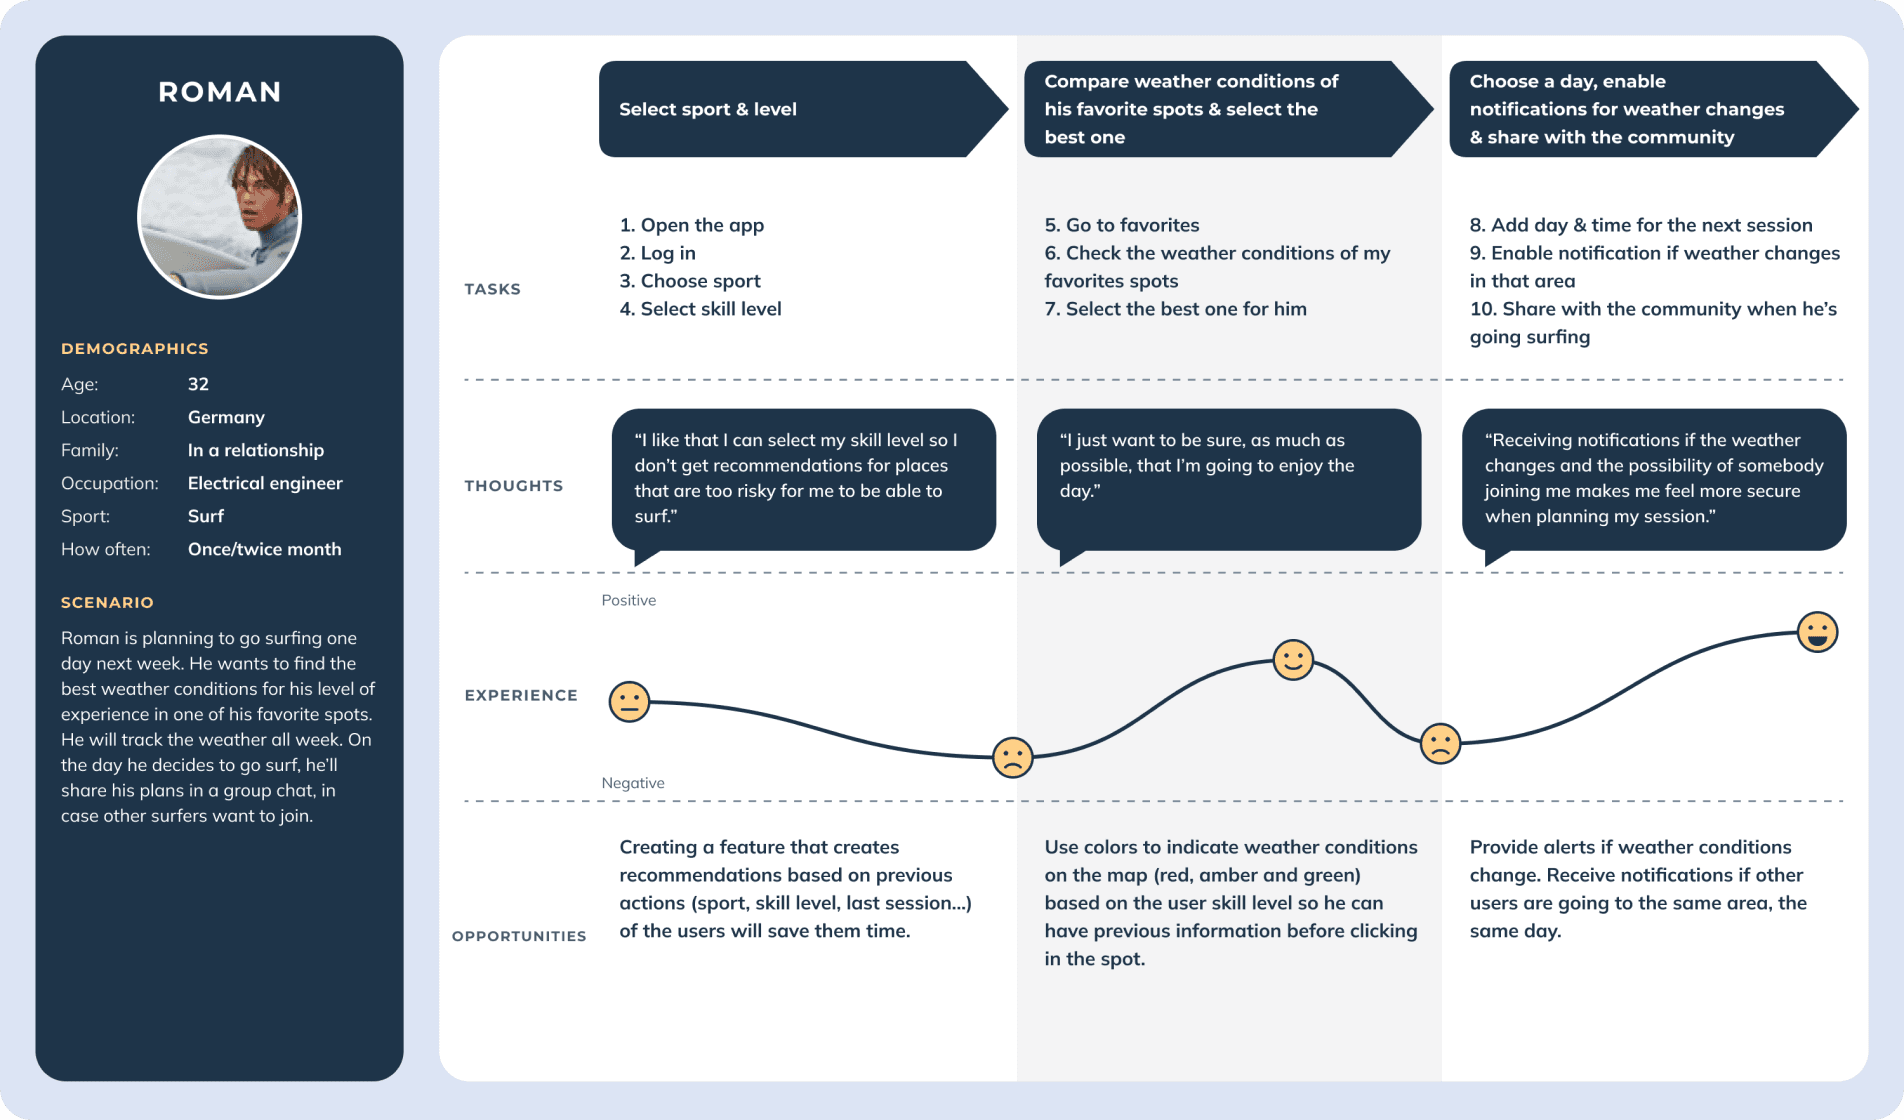
Roman’s journey
From choosing sport and level to sharing his session.
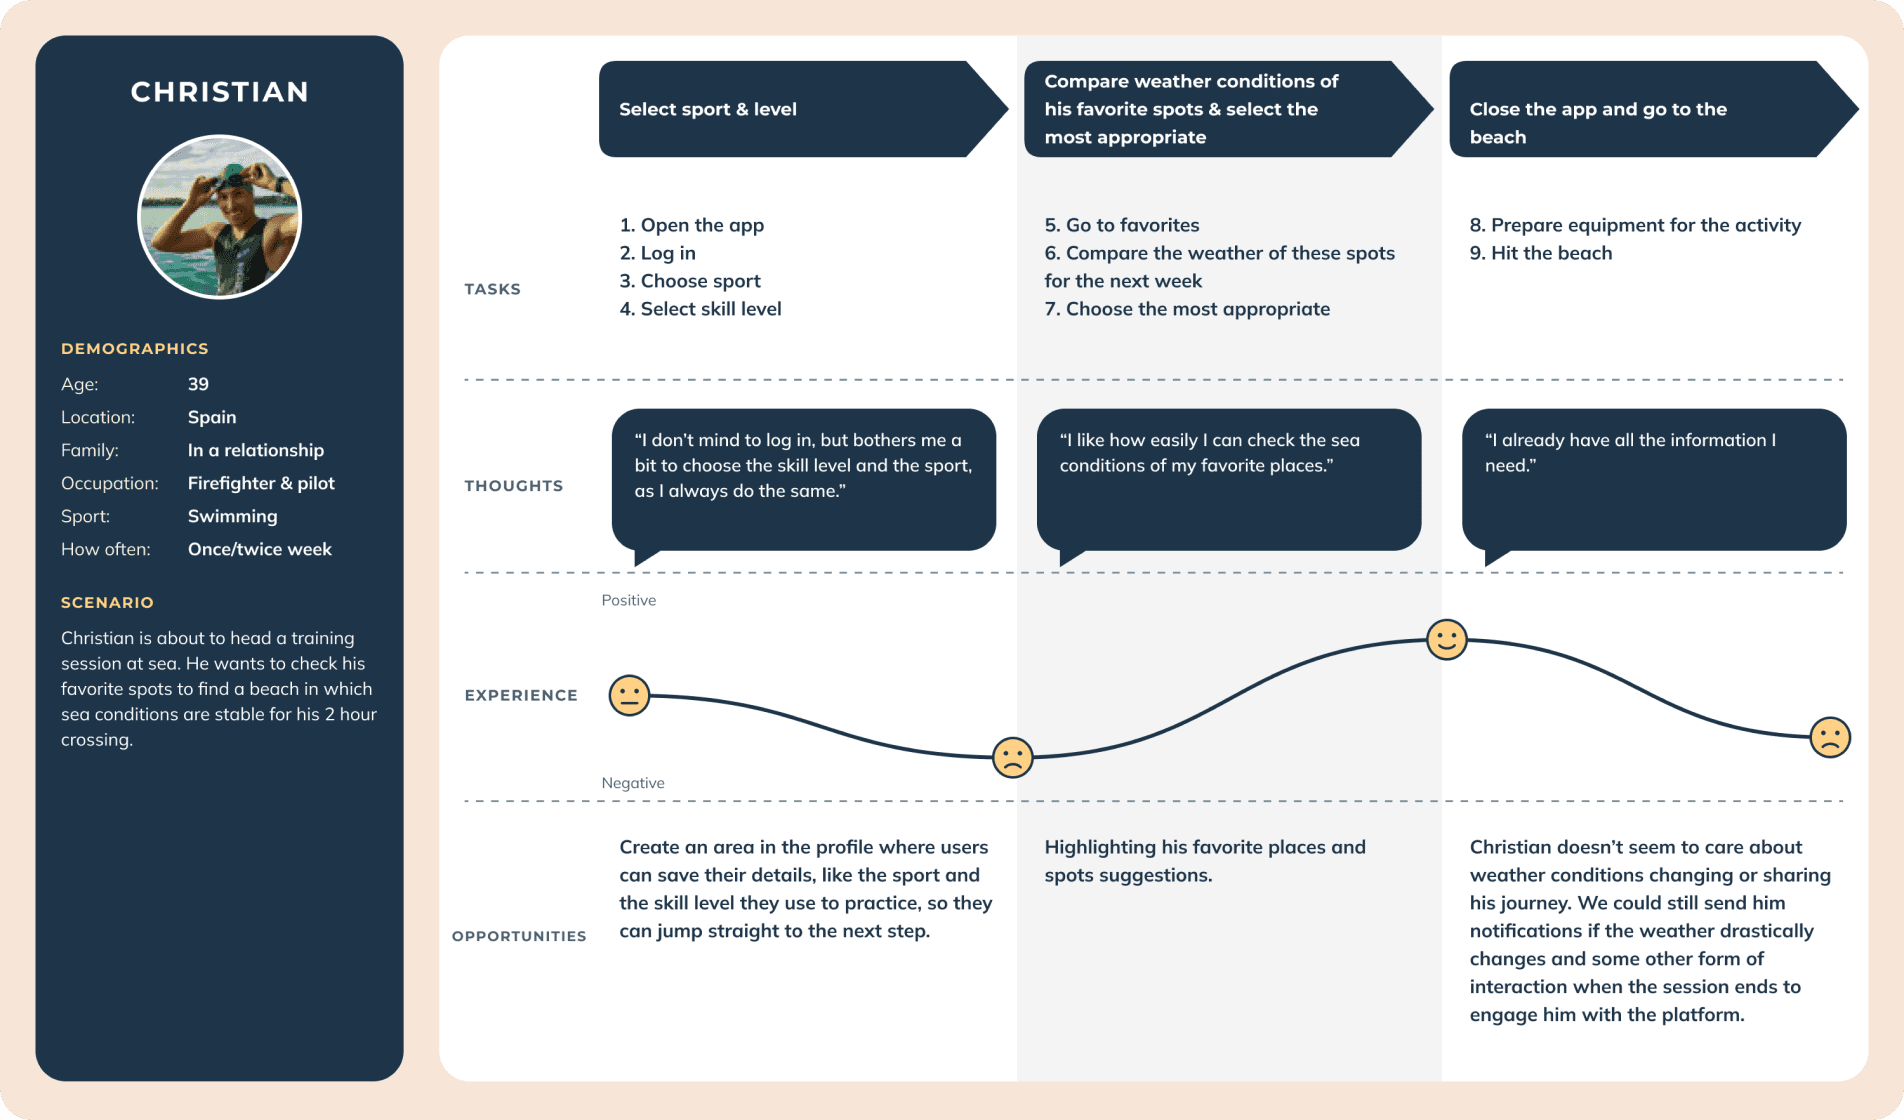
Christian’s journey
From choosing sport and level to heading to the beach.
User flows
With a clear picture of the users and their needs, I focused on how they would interact with the app. Cormorant could become complex, so I kept the flows simple and straightforward to stop the prototypes from becoming unnecessarily complicated.
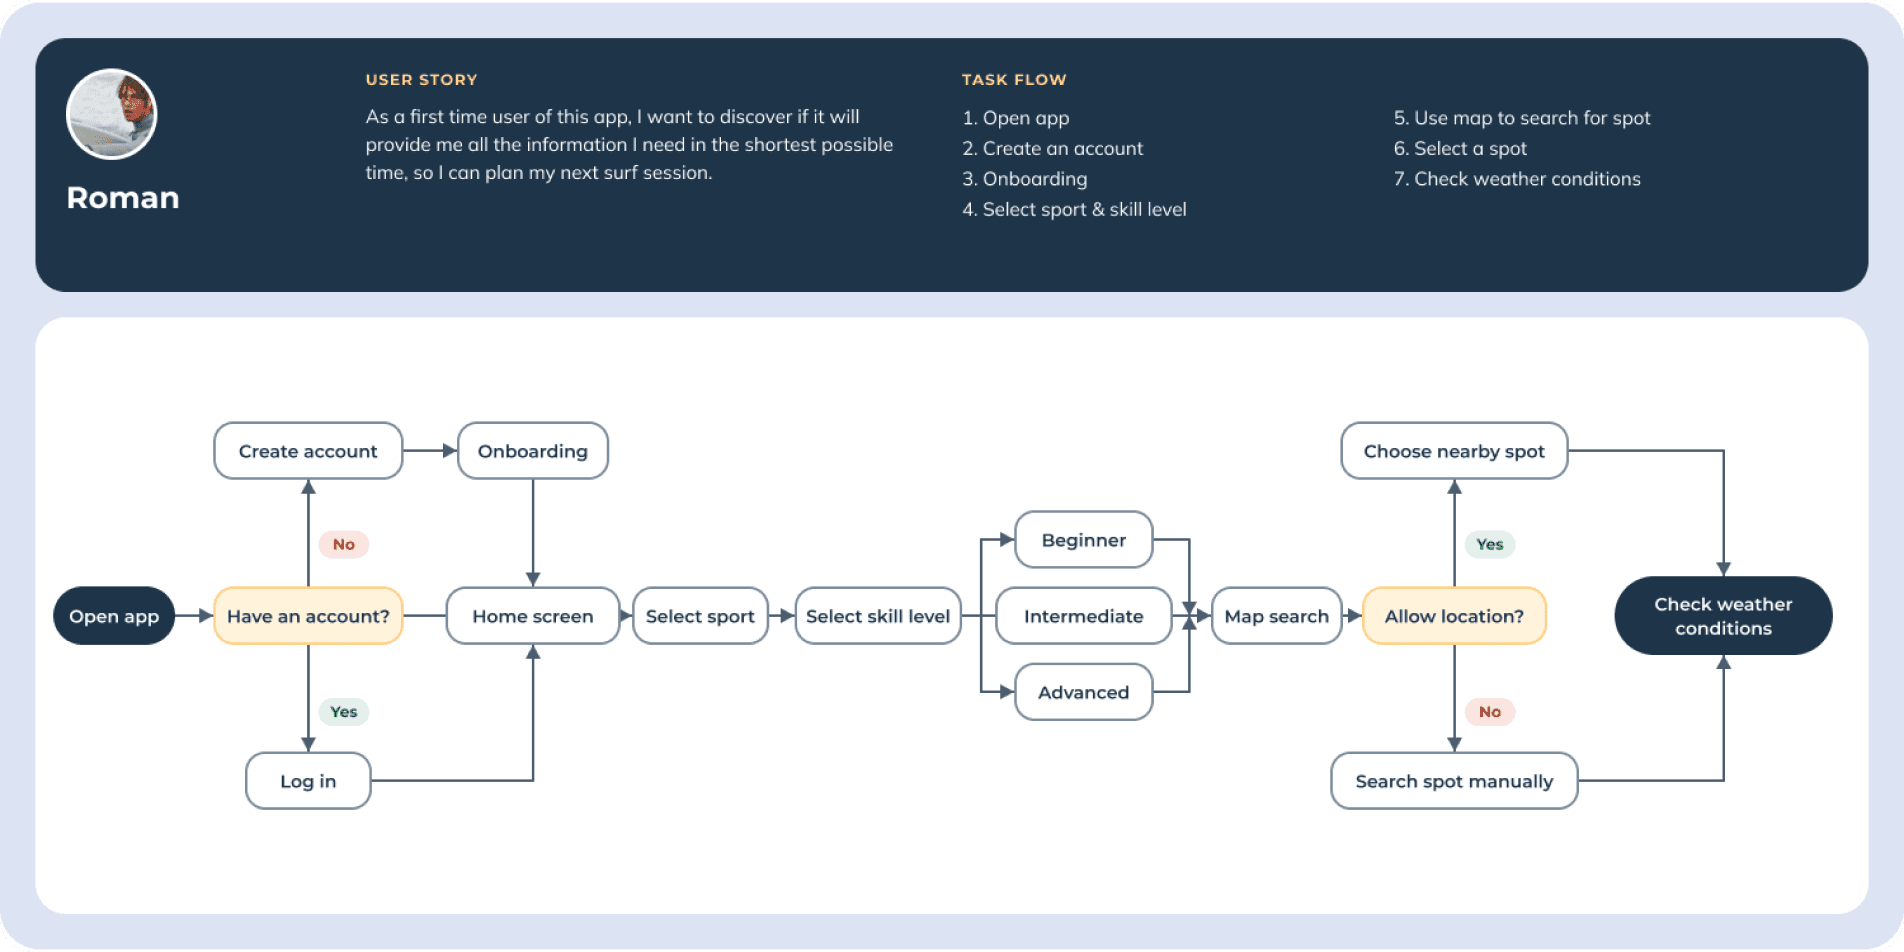
First use: from opening the app to checking conditions
Roman creates an account, picks sport and level, and searches the map.
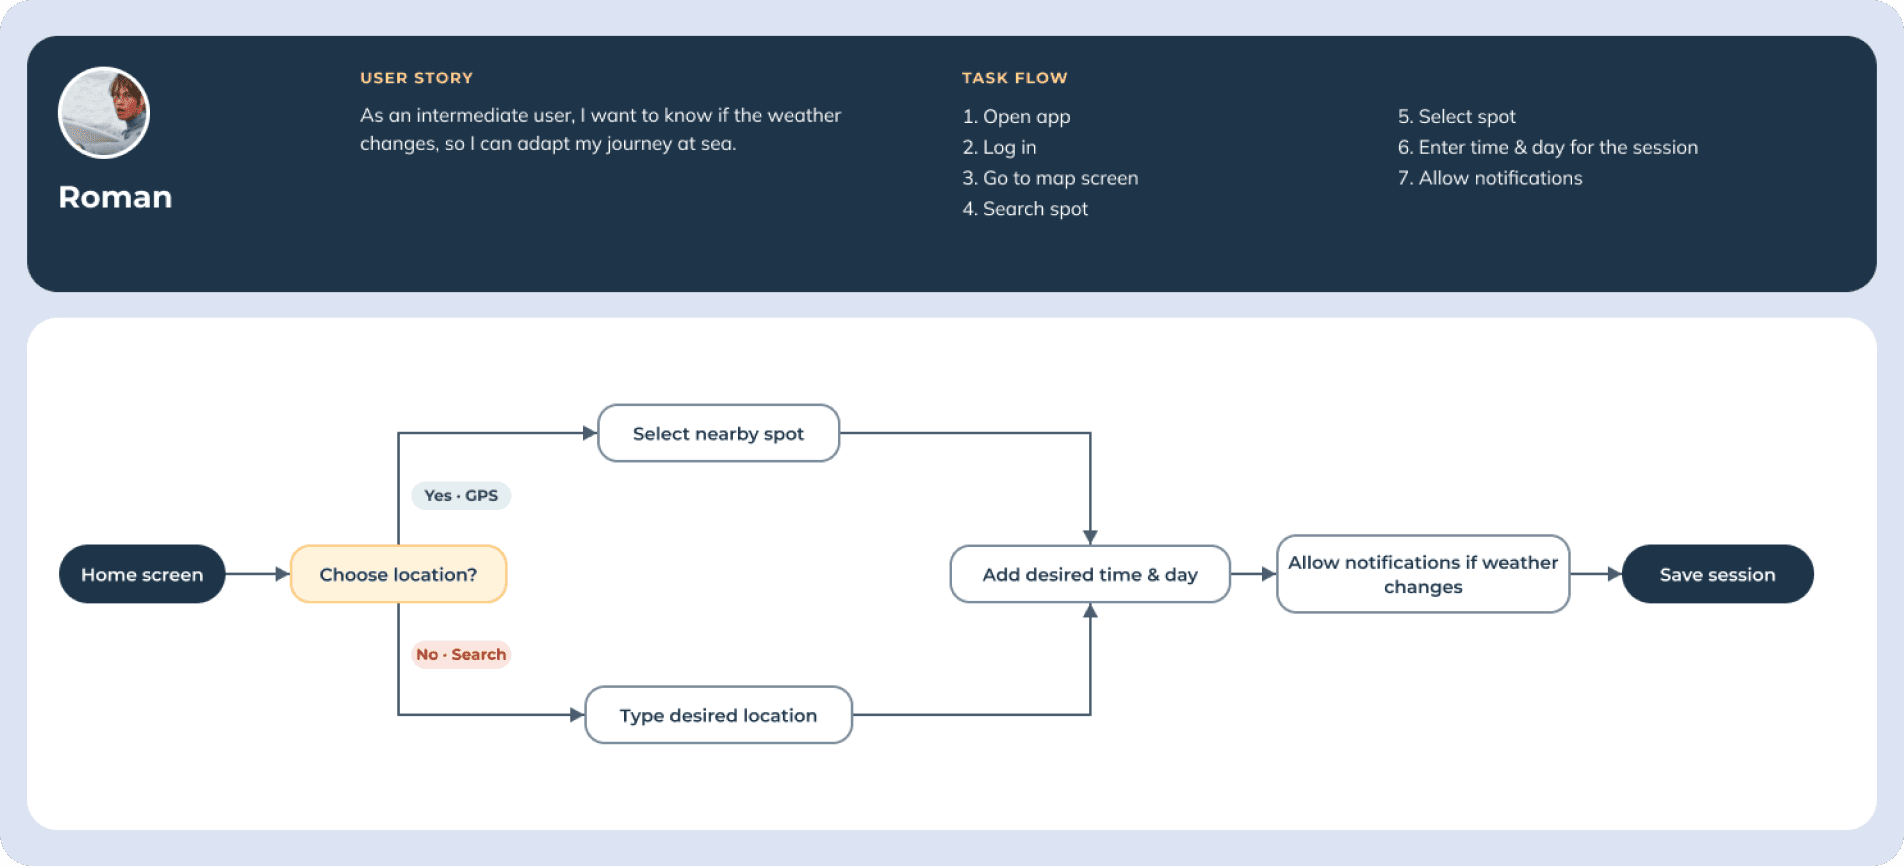
Planning a session with notifications
Roman picks a location, a day and a time, and turns on weather alerts.
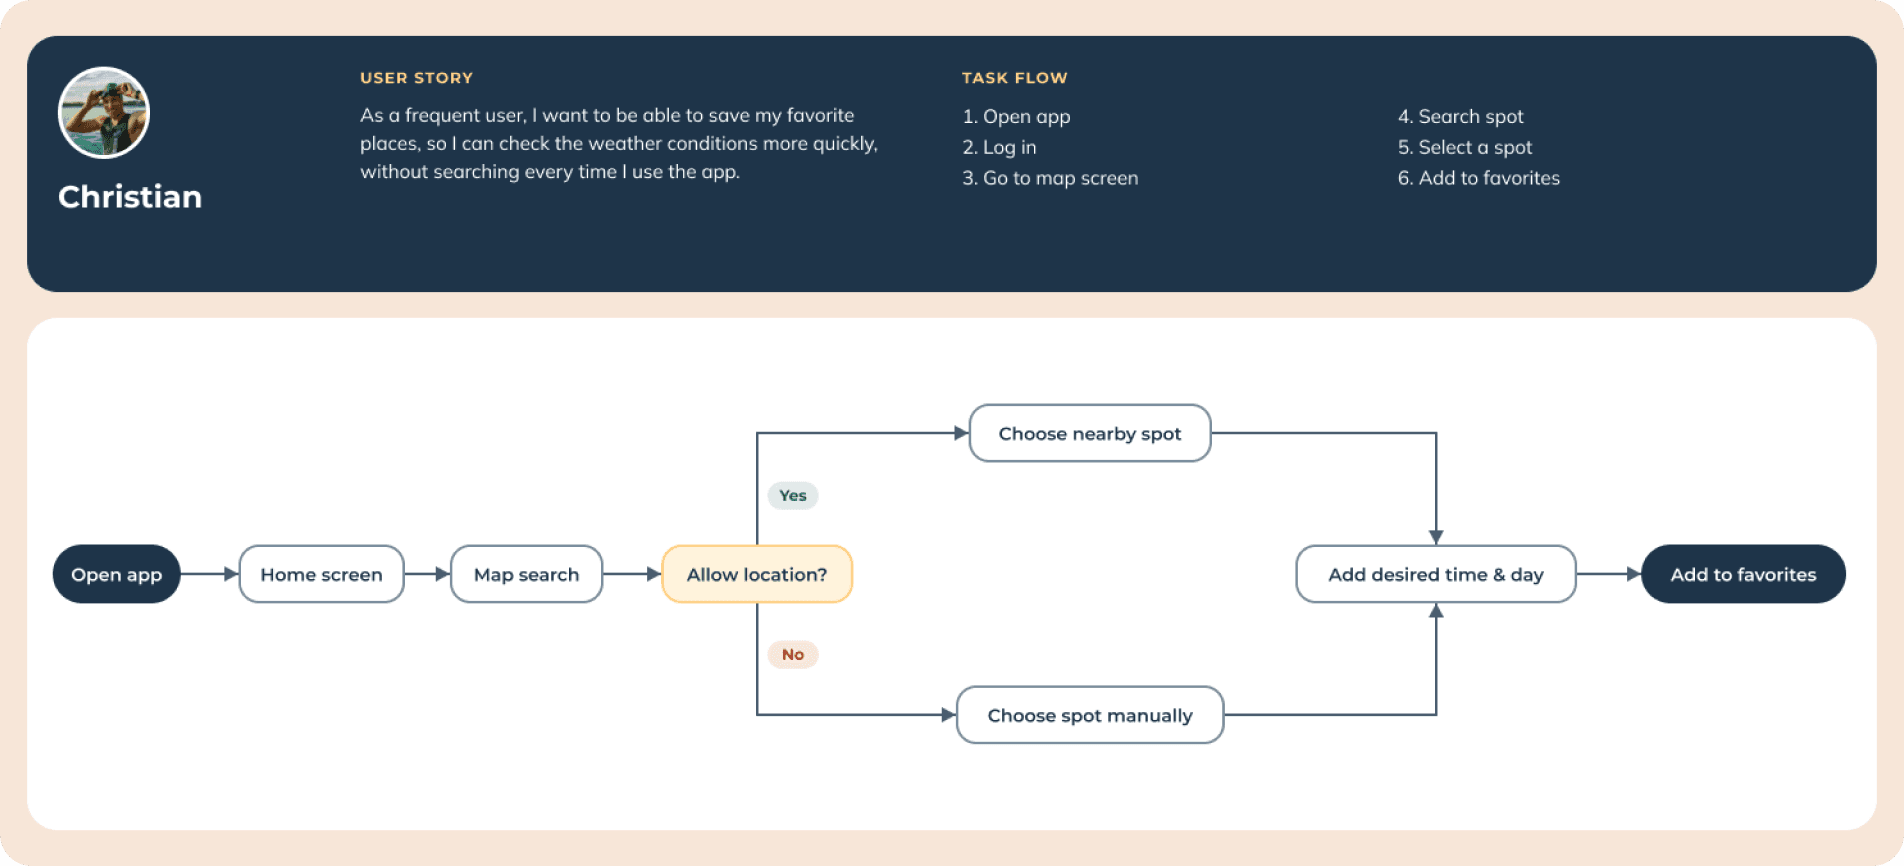
Saving a favorite spot
Christian finds a spot and adds it to favorites to check it faster next time.
Sitemap and card sorting
To make the structure intuitive, I drew a sitemap and tested it with a card sorting study on Optimal Workshop, asking people to group features by relevance and importance.
Card sorting
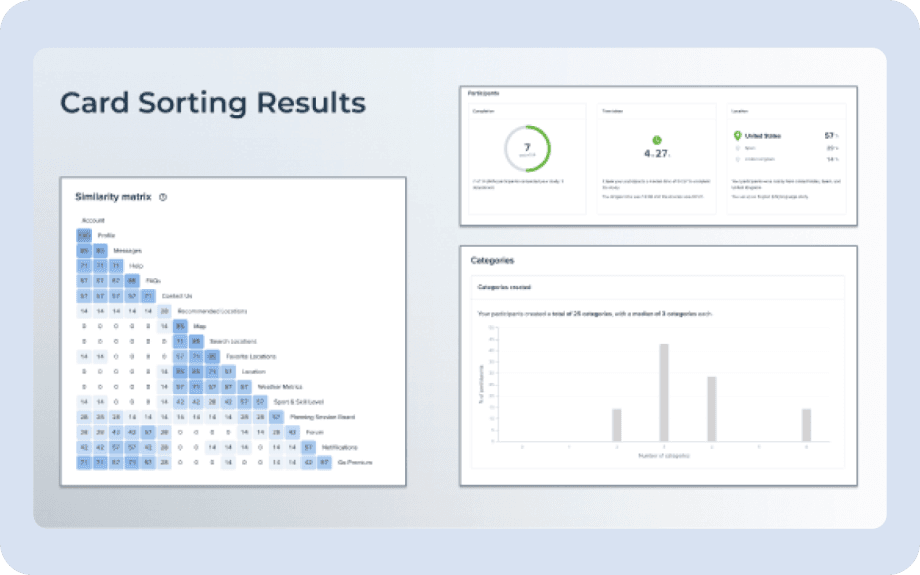
Seven participants, a median of three categories.
Participants created 25 categories in total, with a median of 3 each, which confirmed a sitemap with three branches: Community, Homepage and Settings.
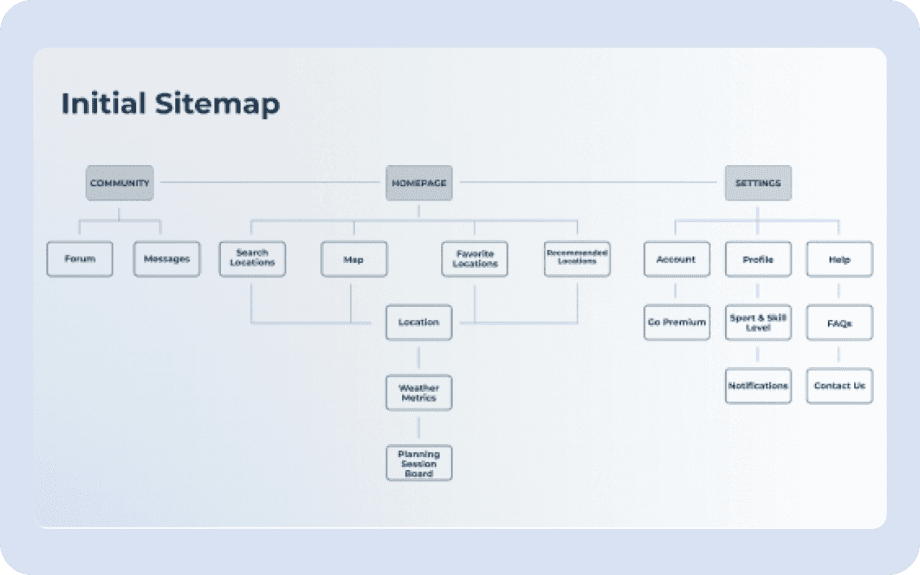
Initial sitemap
Three branches: Community, Homepage and Settings.
Card sorting results
Similarity matrix and categories created by 7 participants.
Sitemap revision
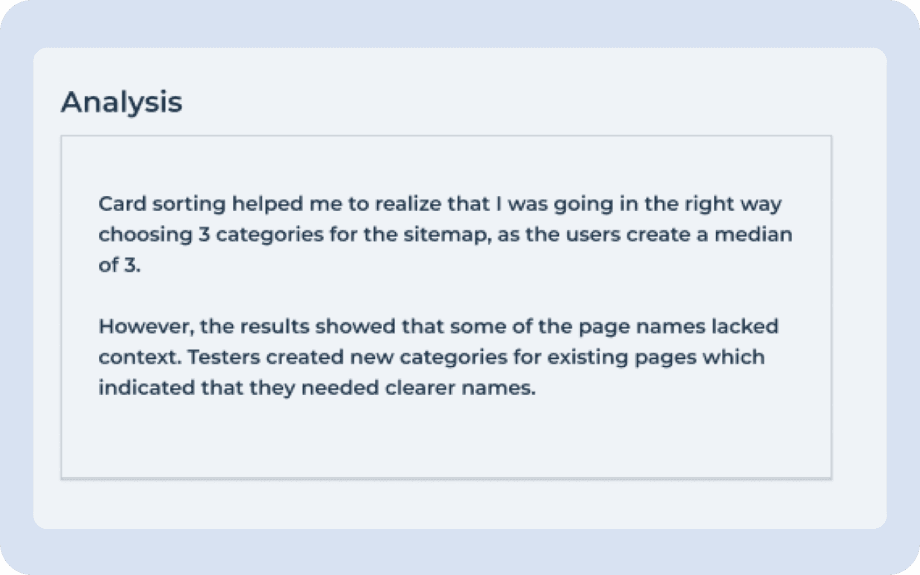
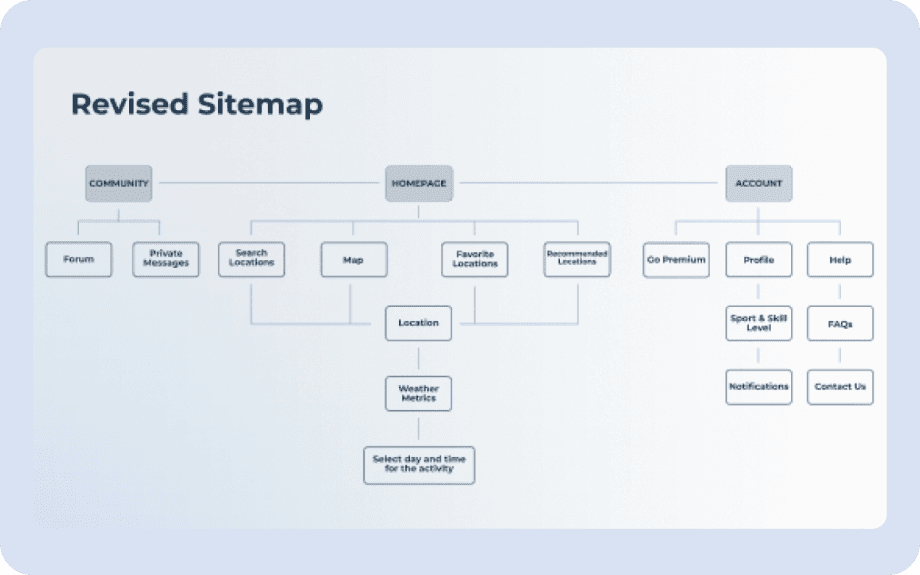
The results showed I was heading in the right direction, but some names and categories needed adjusting. The revised sitemap is more intuitive and easier to navigate.
Revision
Clearer names, same structure.
Some page names lacked context: testers created new categories for existing pages. I renamed them (Messages became Private messages, for example).
Analysis
What card sorting told me about names and categories.
Revised sitemap
Clearer page names and a simpler structure.
Prototype and test
Low-fidelity wireframes
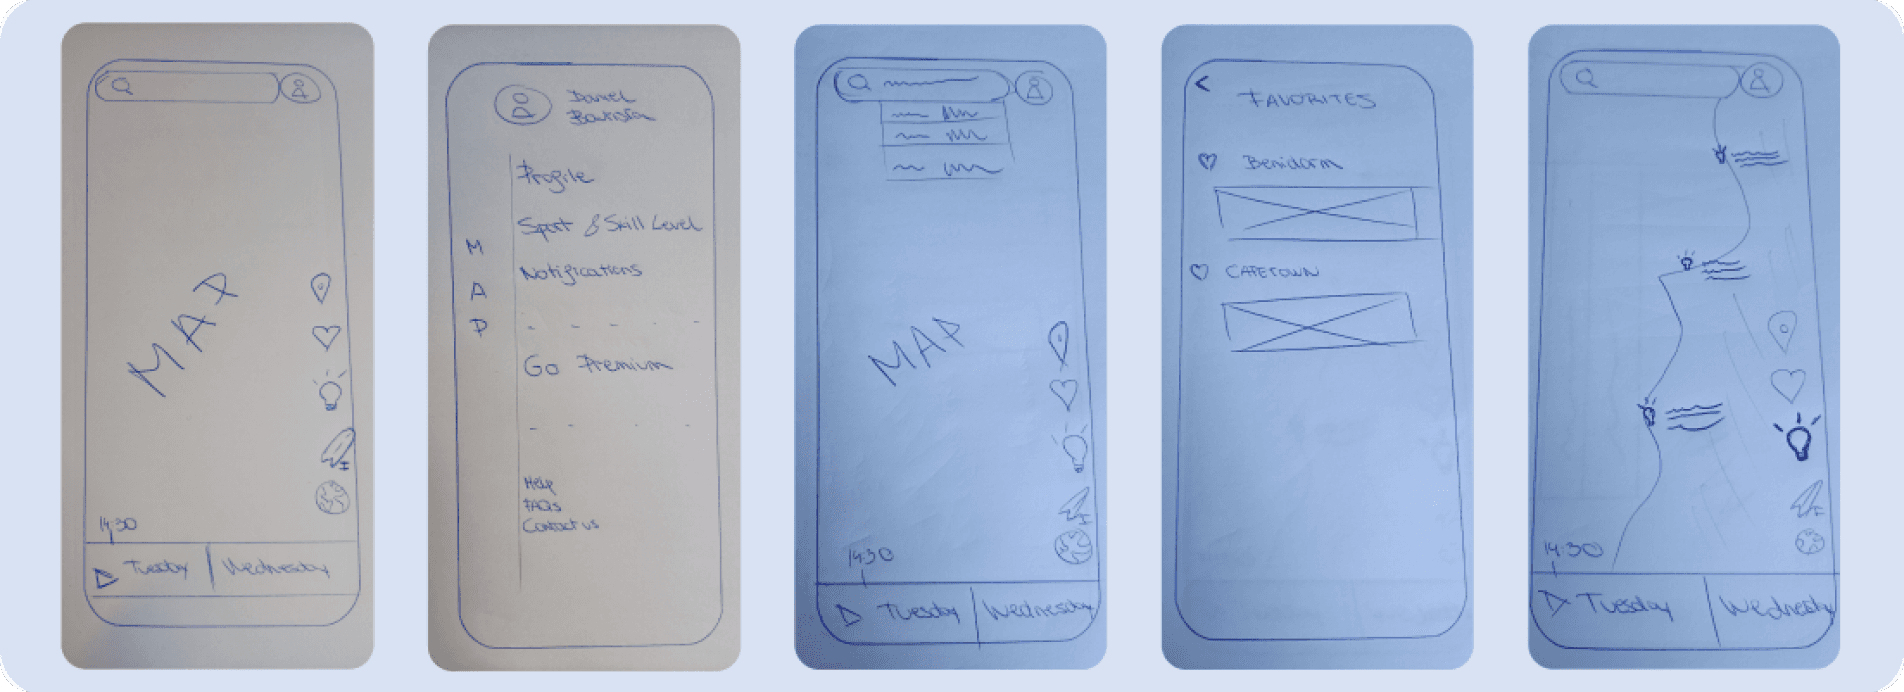
To start prototyping, I sketched low-fidelity wireframes for the home and admin pages from the sitemap. Pen and paper let me explore layouts and content quickly before moving to polished wireframes.
Sketches on paper
Map, menu, search and favourites, drawn by hand before any pixels.
Mid-fidelity wireframes
While working out the onboarding I moved to mid-fidelity screens in Figma. I first planned coach marks, but feedback from other UX designers led me to highlight overlays.
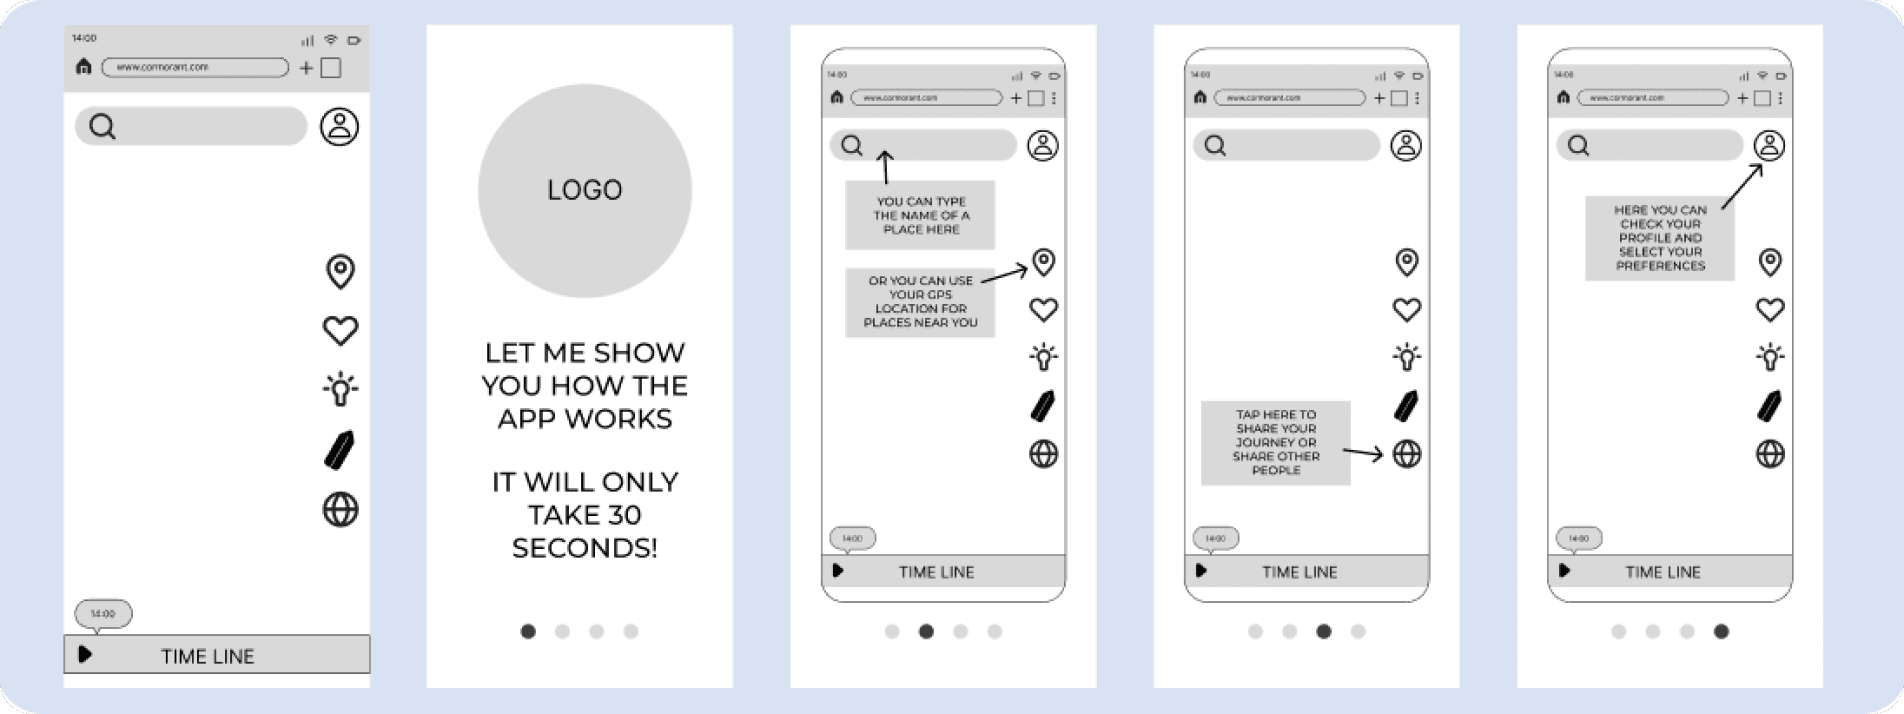
Onboarding with highlight overlays
A short welcome, then overlays that point at search, location, sharing and your profile.
Usability testing
Before designing high-quality wireframes I tested the prototype to check that the core features worked. Six participants from my network, practising different watersports at different levels, took part.
Findings
Missing back button, unclear icons.
Testers missed a back button, did not find the home icons on other pages, hesitated between “Plan your journey” and “Upcoming days” and did not understand what the timeline was for.
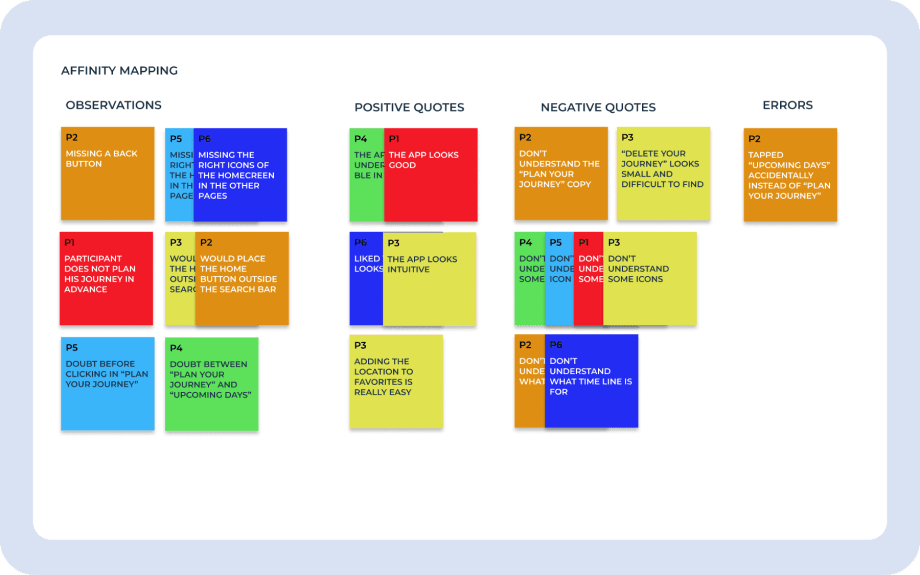
Usability test, affinity mapping
Observations, quotes and errors from six participants.
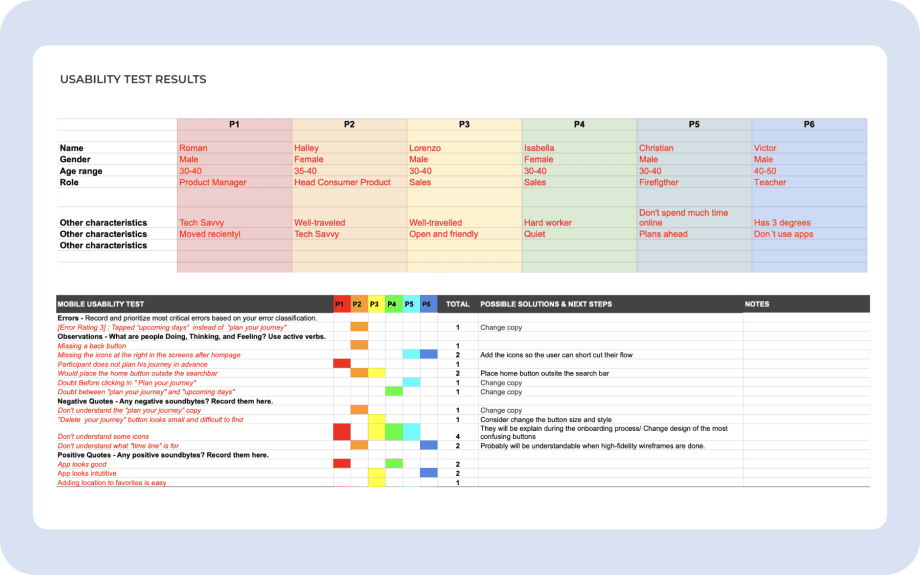
Usability test results
Participants, errors and the solutions I listed.
Fixing issues and preference test
While fixing the issues I designed a single high-fidelity screen and ran a preference test on UsabilityHub with 12 participants to decide which design direction to follow.
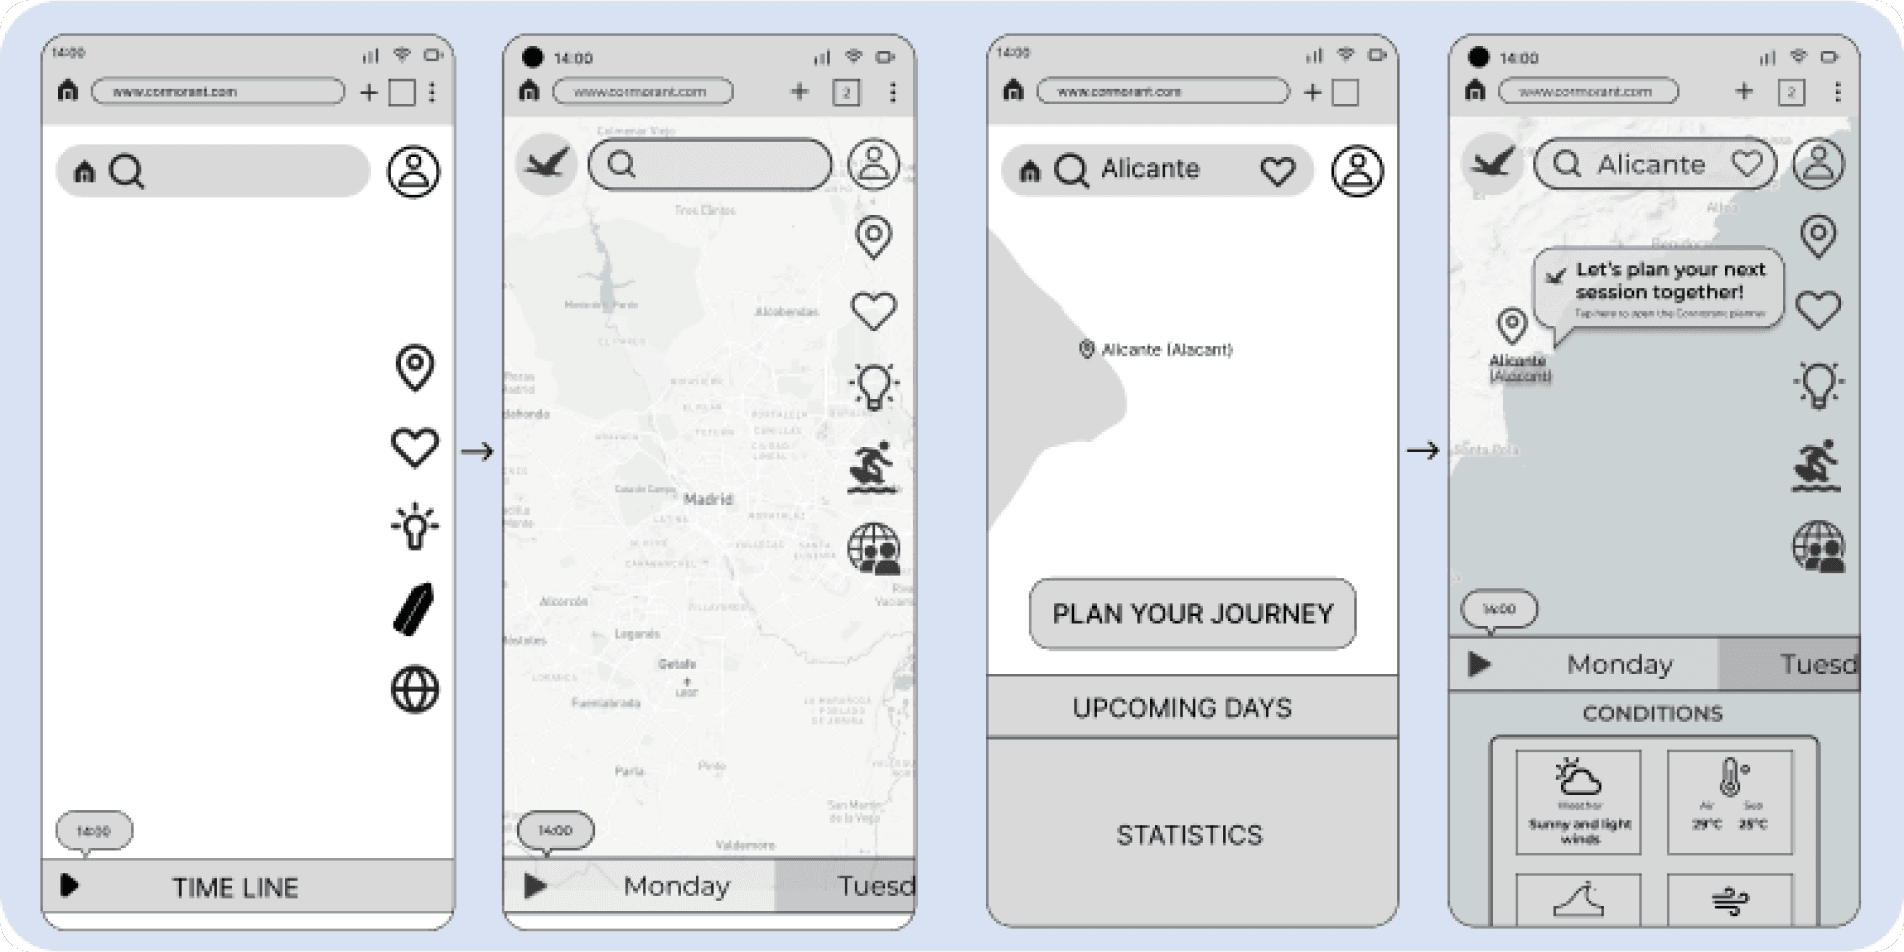
Fixing what testers found
The home icon leaves the search bar, and named days and condition cards replace the timeline and the confusing buttons.
Refine
High-fidelity wireframes
I carried on with high-fidelity wireframes for the rest of the app’s main features.
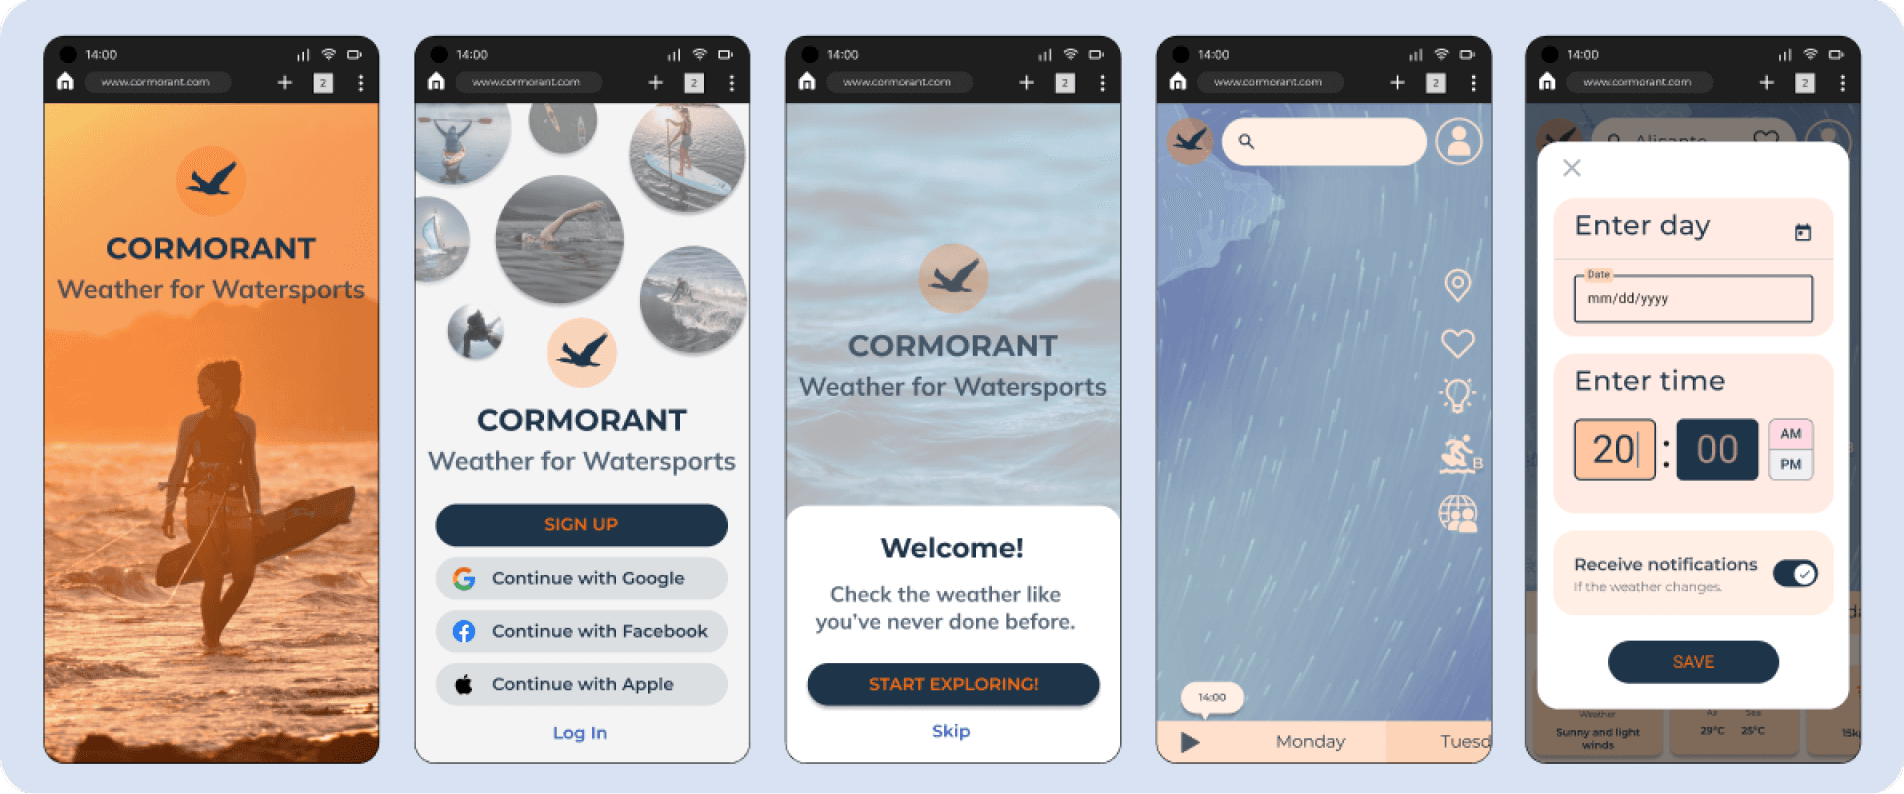
High-fidelity screens
Splash, access, welcome, map and session planner.
Design iterations
After learning more about Gestalt principles, emotional design, accessibility and usability, I applied them to my wireframes and asked other designers for feedback to create the final UI.
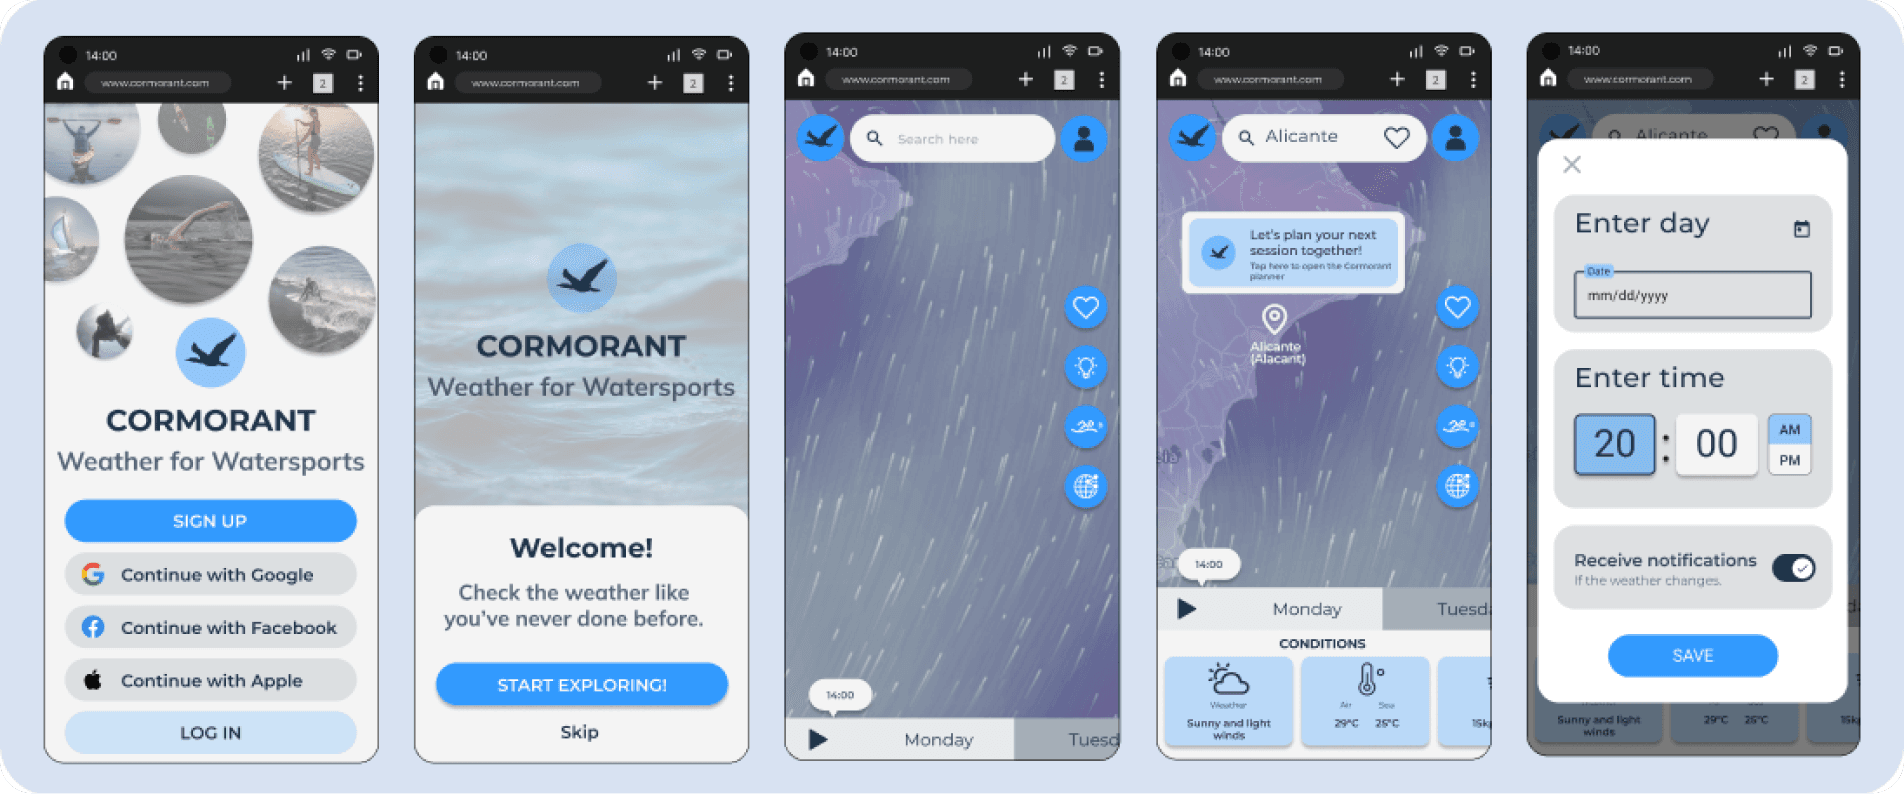
Design iterations
From the first high-fidelity screens to the final UI.
Design language system
Finally I gathered all the UI and visual decisions in a design language system to keep the app consistent.
Palette
Blue, navy and white.
Colours associated with water and calm; secondary tones reuse the same blues at lower opacity, with white copy on buttons for legibility.
Type
Montserrat and Mulish.
Montserrat as the primary font because it is simple and easy to read; Mulish only for subtitles.
Components
Floating icons, 25 px radius.
Icons float on the map or inside cards at 24 to 32 pt, buttons are filled or outlined with a 25 radius, and a four-column grid with 16 px margins keeps the layout consistent.
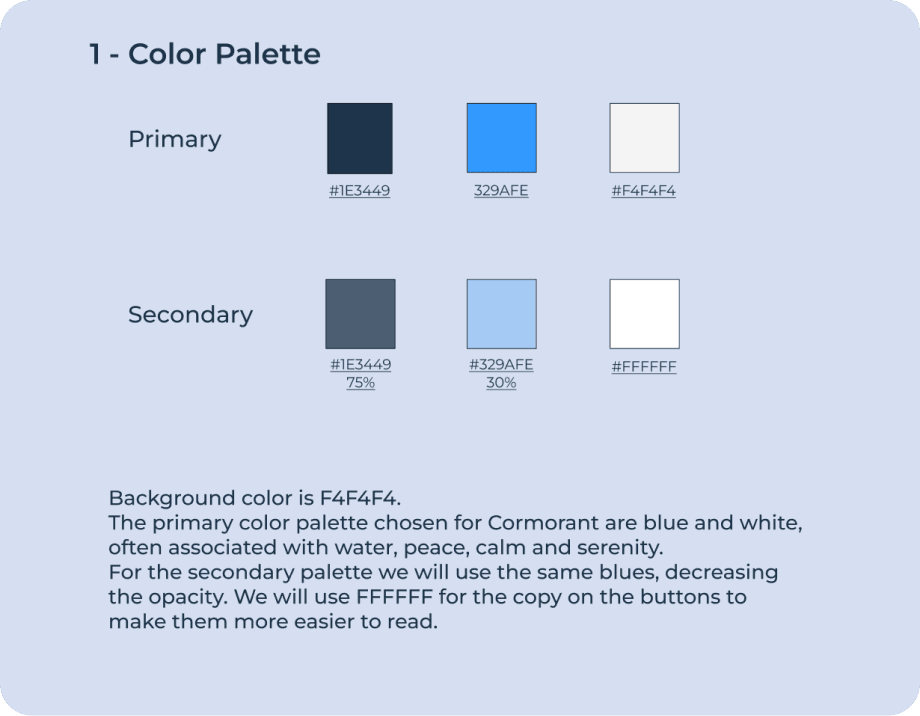
Colour palette
Primary and secondary tones.
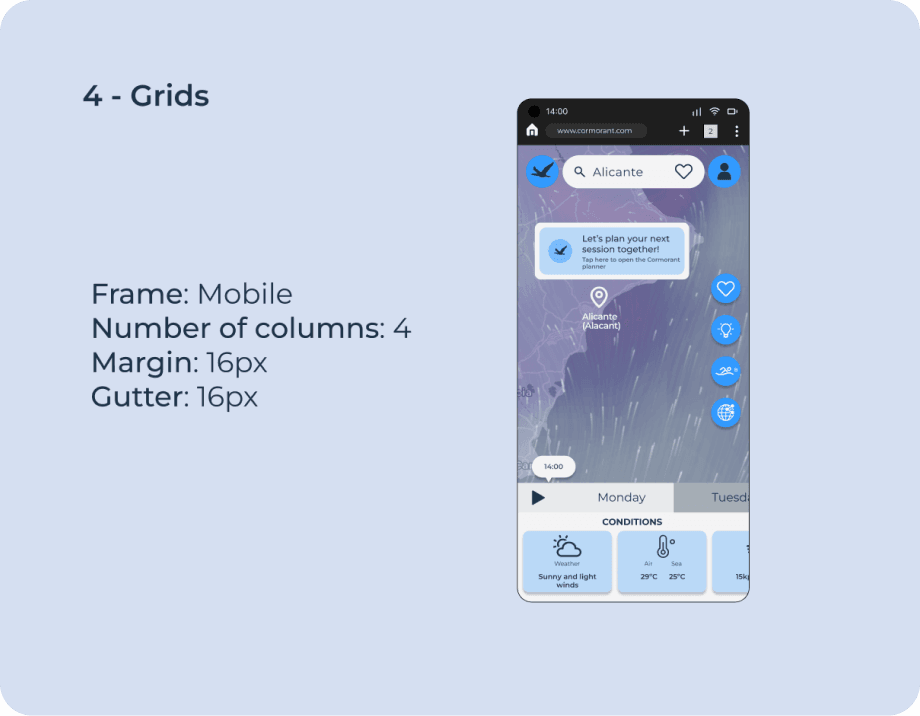
Grids and layout
Four columns, 16 px margins and gutters.
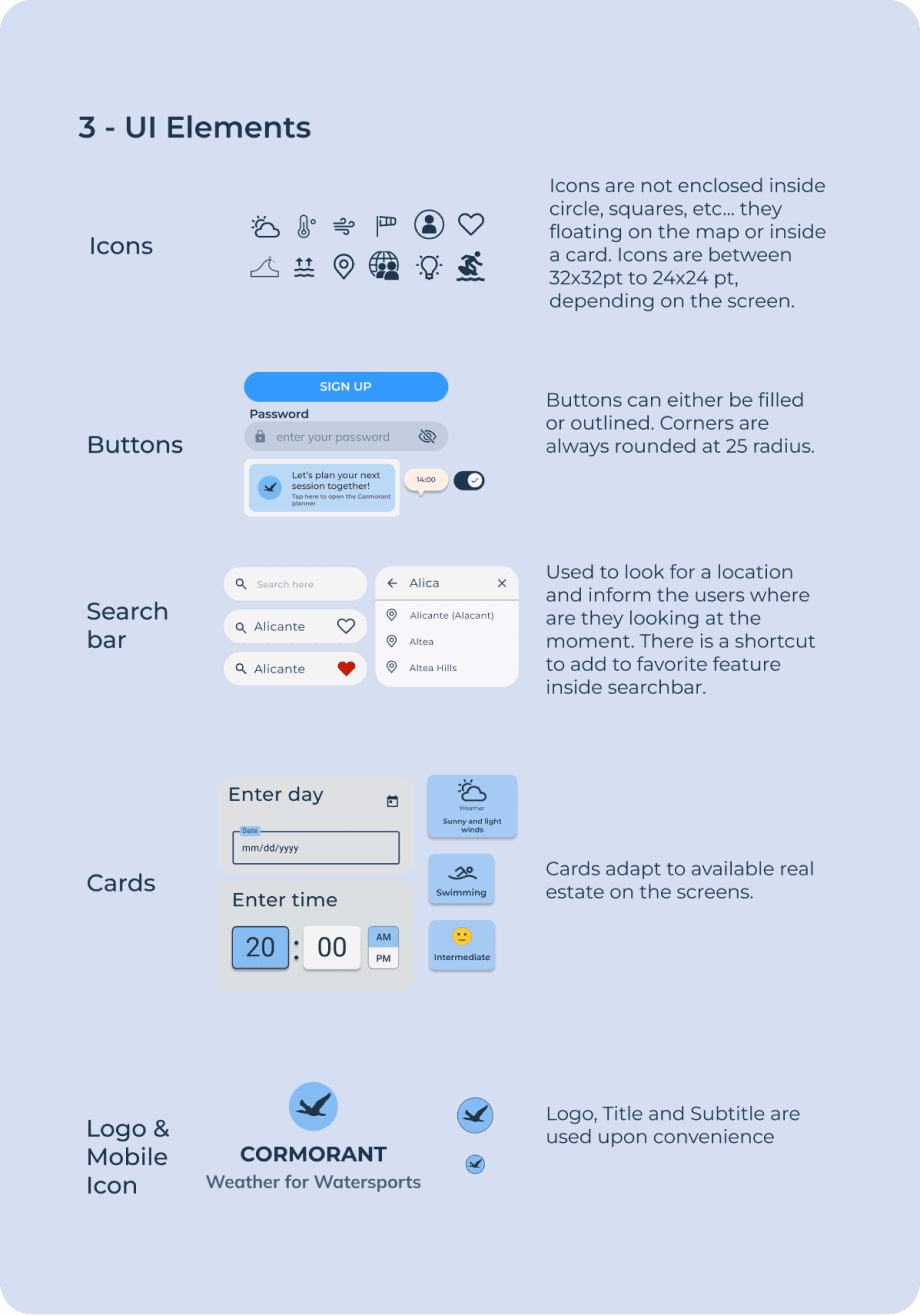
UI elements
Icons, buttons and search bar.
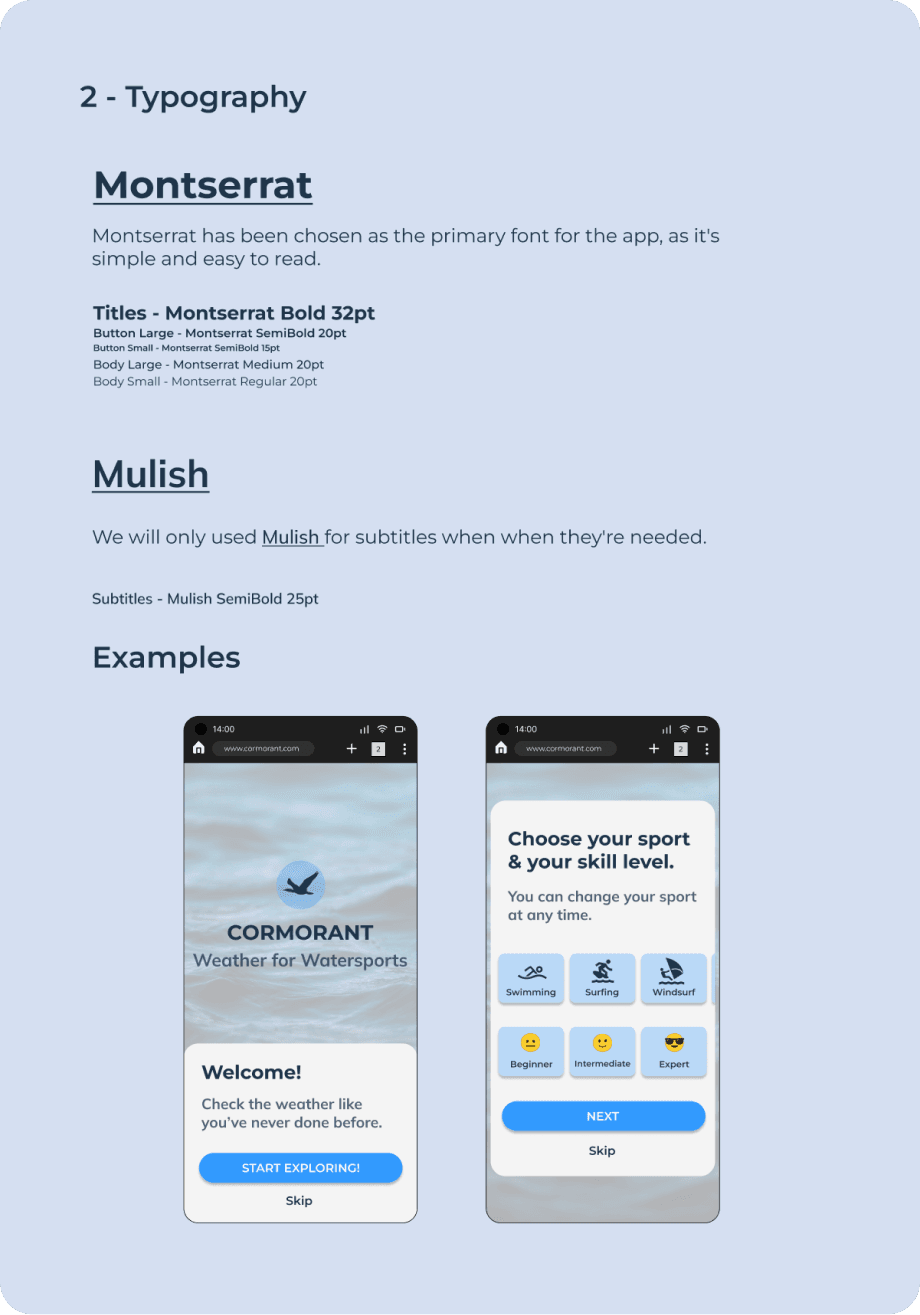
Typography
Montserrat and Mulish.
Redesign
Looking at it again, with fresh eyes
The app worked, but its screens were far from what the research asked for. I audited the interface and redesigned the key screens.
Navigation
Icons nobody could read.
Four of six testers misread some icons and the timeline. The floating buttons became a labelled tab bar on every screen, the level badge a “Surfing · Intermediate” chip, and the timeline a bottom sheet with named days.
Clarity
Data without a verdict.
Metrics were small, and users felt they had to be experts to read them. A verdict card now says whether conditions are good for their level, and waves, the key data for watersports, get their own tile.
Map
Risk you can see.
The journey maps asked for red, amber and green conditions by skill level. The new map colours spots and sea areas that way, with a legend.
Accessibility
Text you can read outdoors.
Labels of 8 to 10 px, a light-blue Skip link and grey fields on grey became 12 to 16 px text and fields with visible borders. The browser bar that stole 80 px is gone.
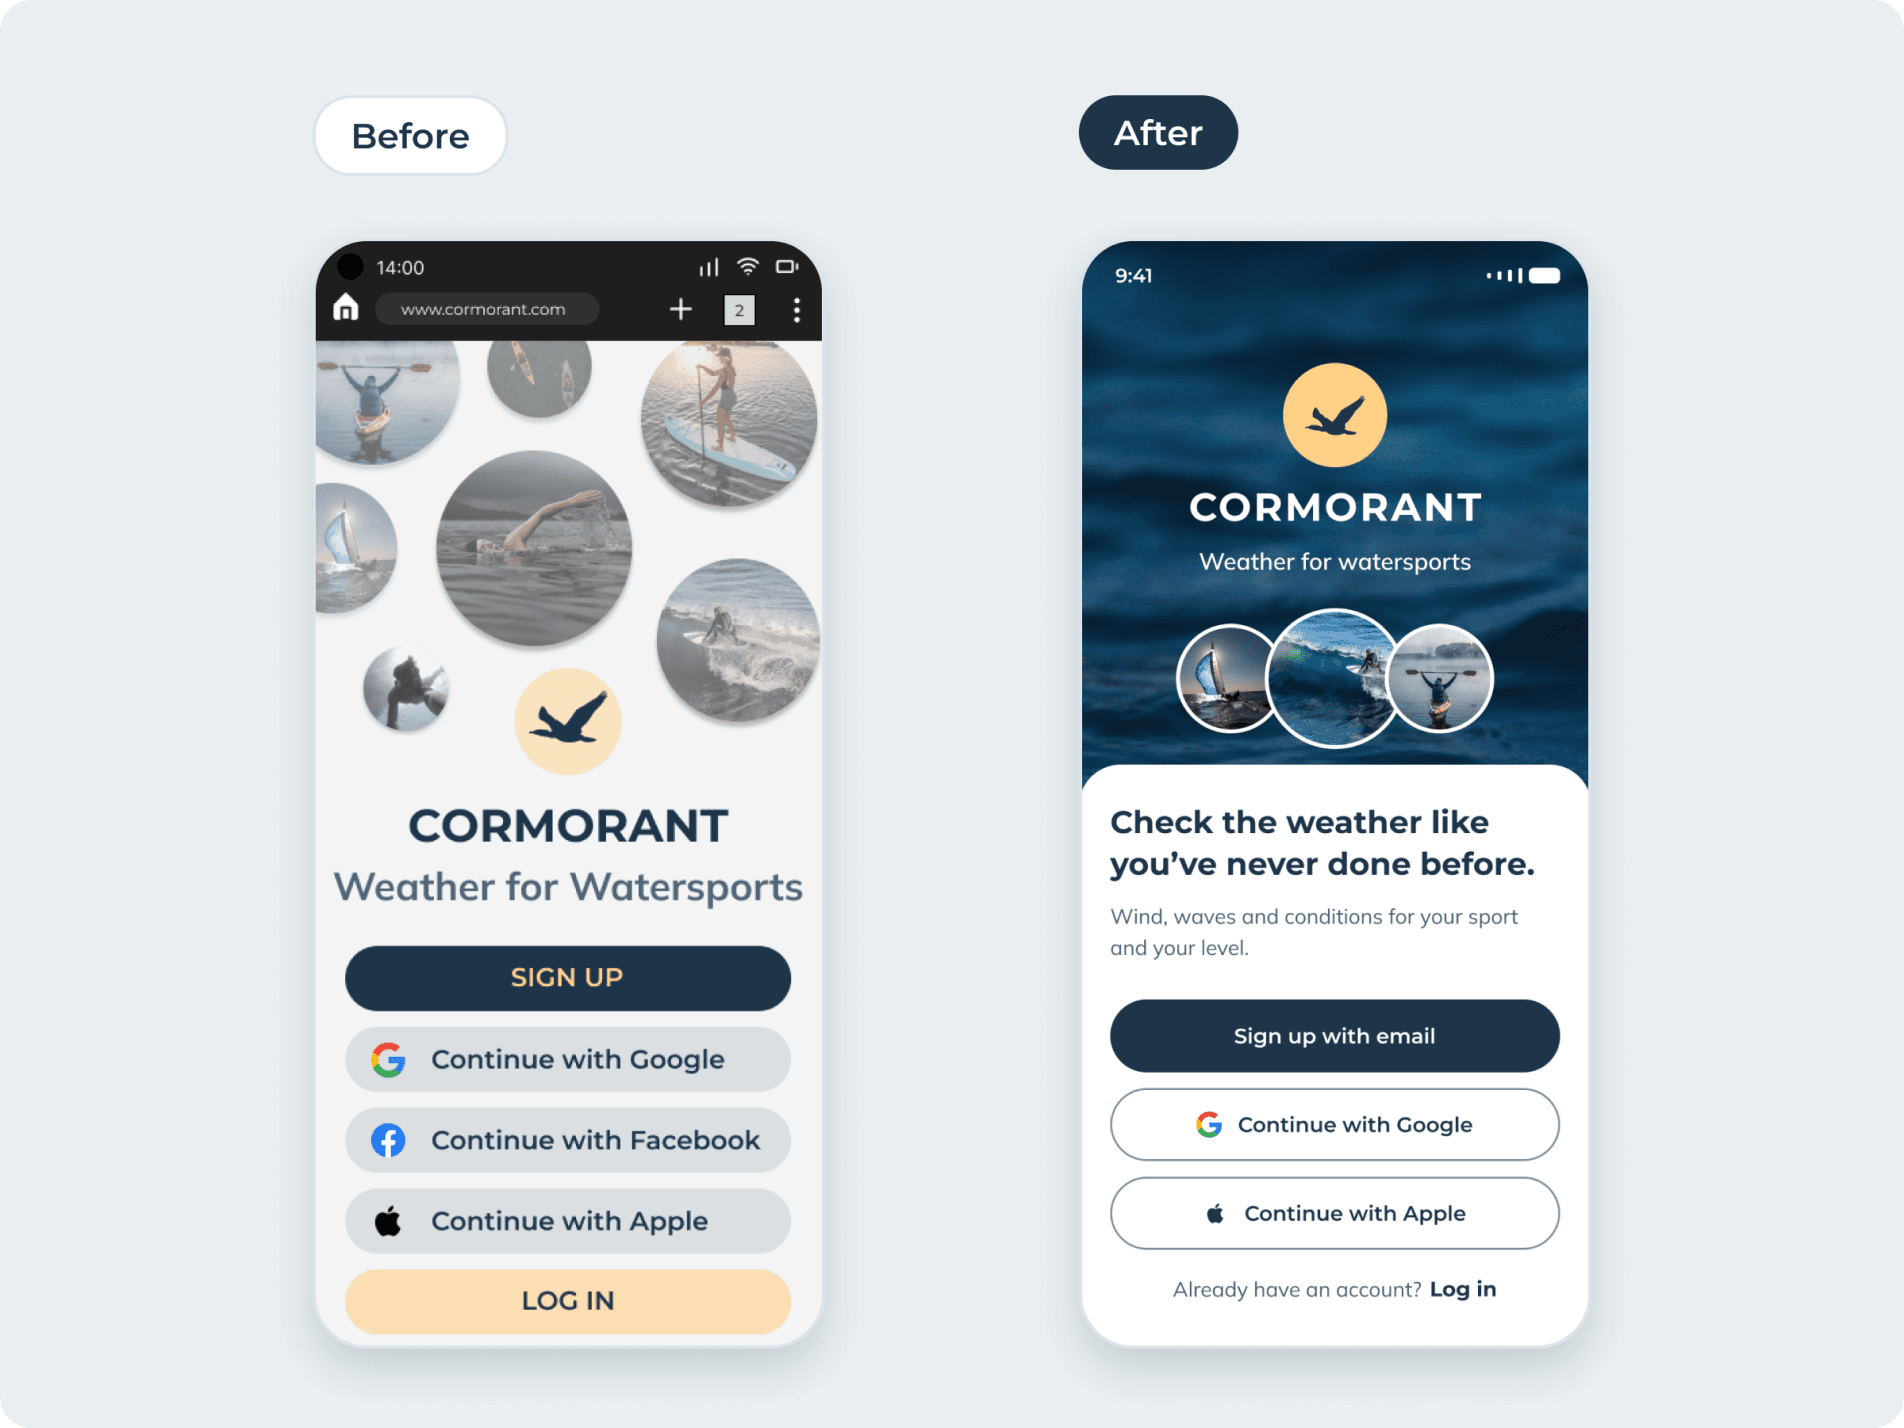
Access: one clear action
Five competing buttons became one primary action, two alternatives and a log-in link.
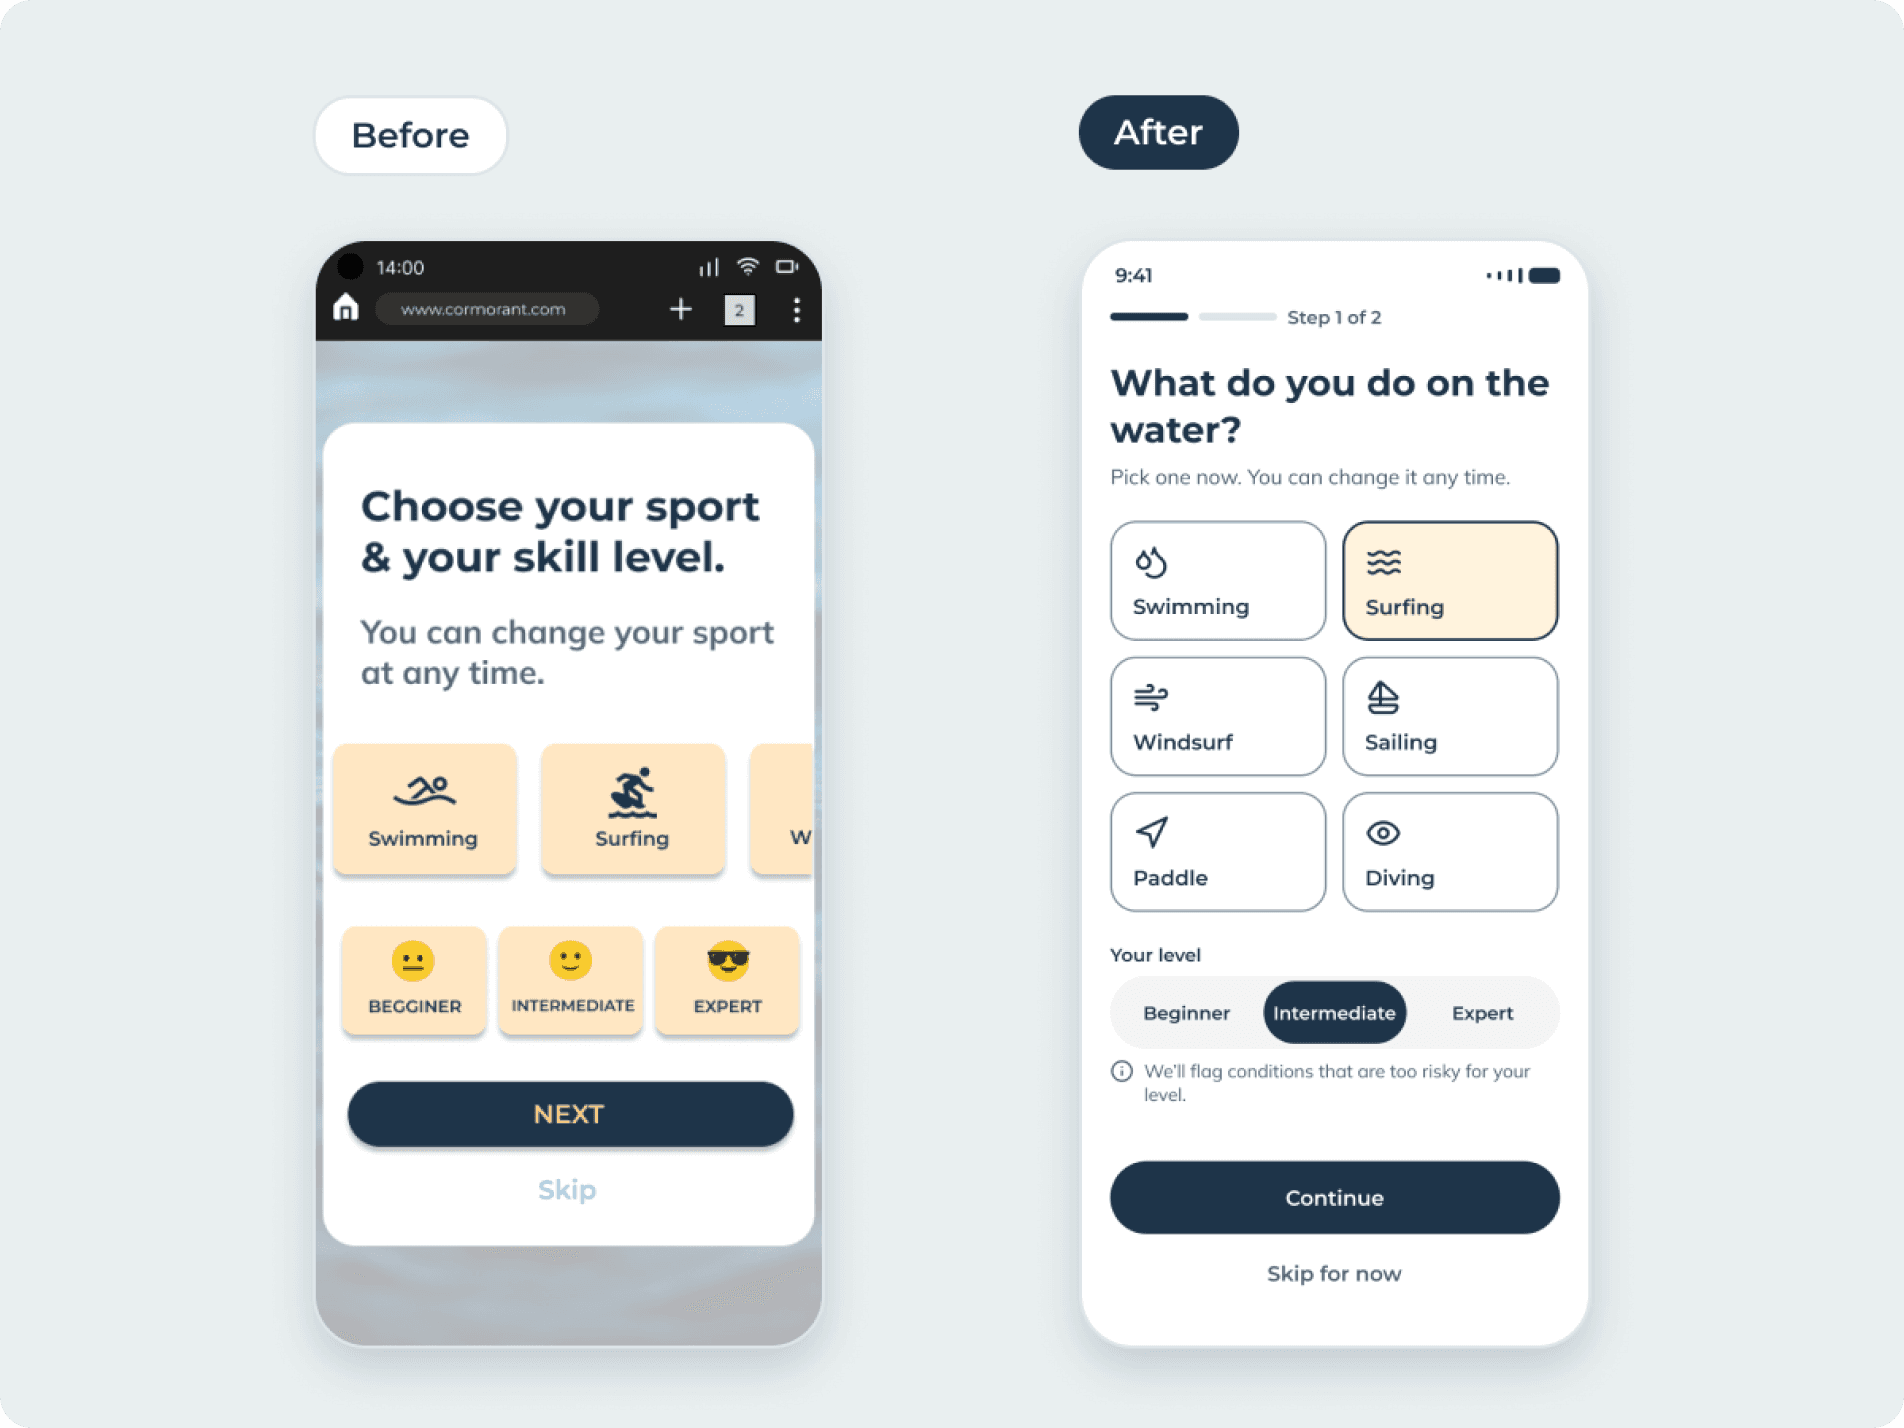
Sport and level without guesswork
Cards no longer scroll out of view, emojis give way to a labelled control and the typo in “Beginner” is fixed.
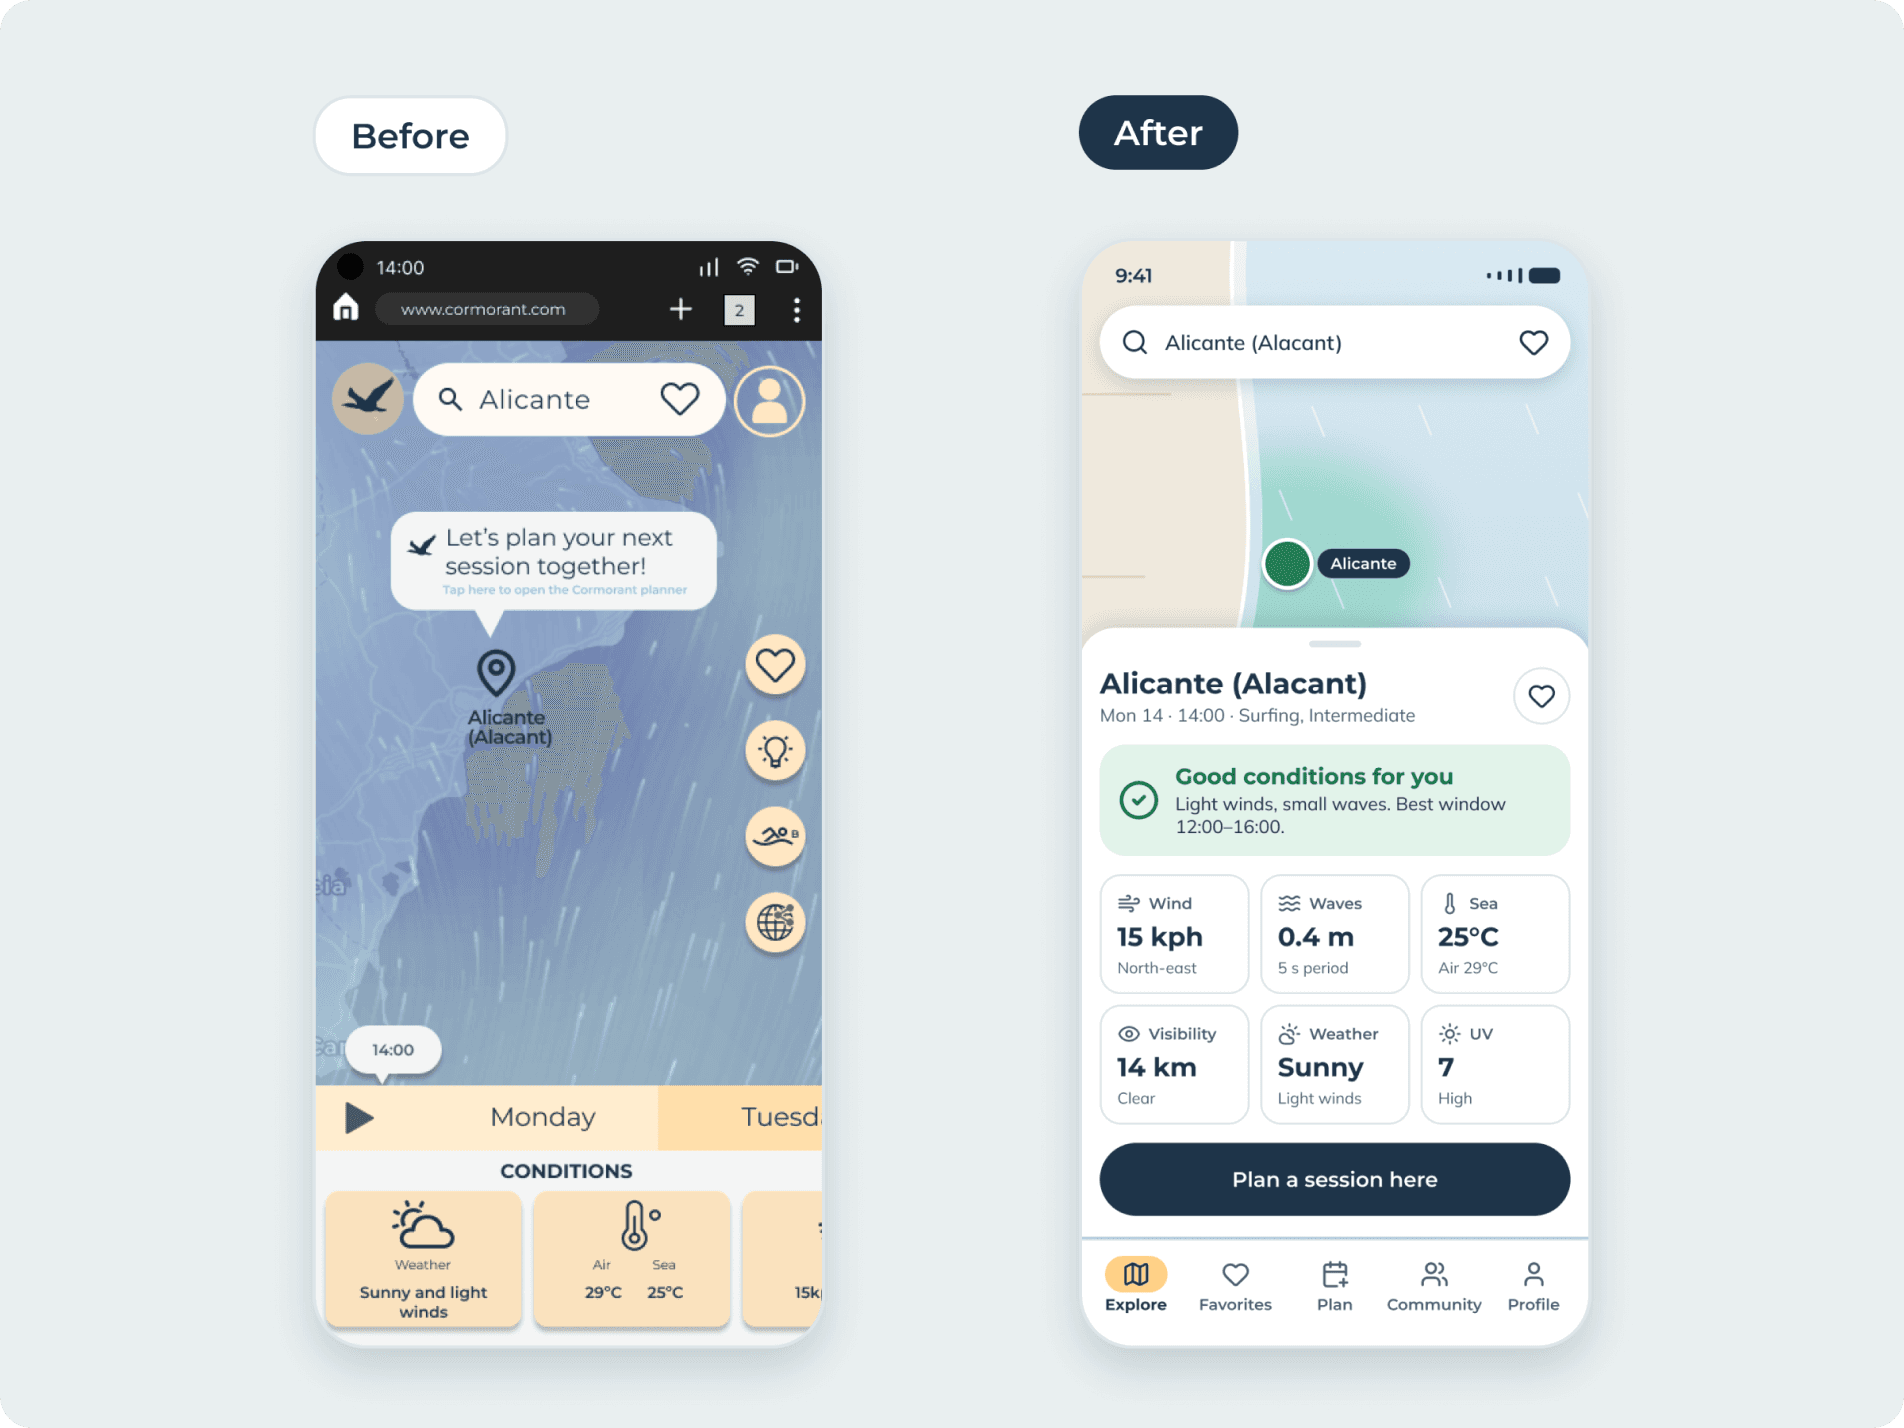
Conditions with a verdict
From three half-visible cards to a verdict plus six metrics, including waves, all visible at once.
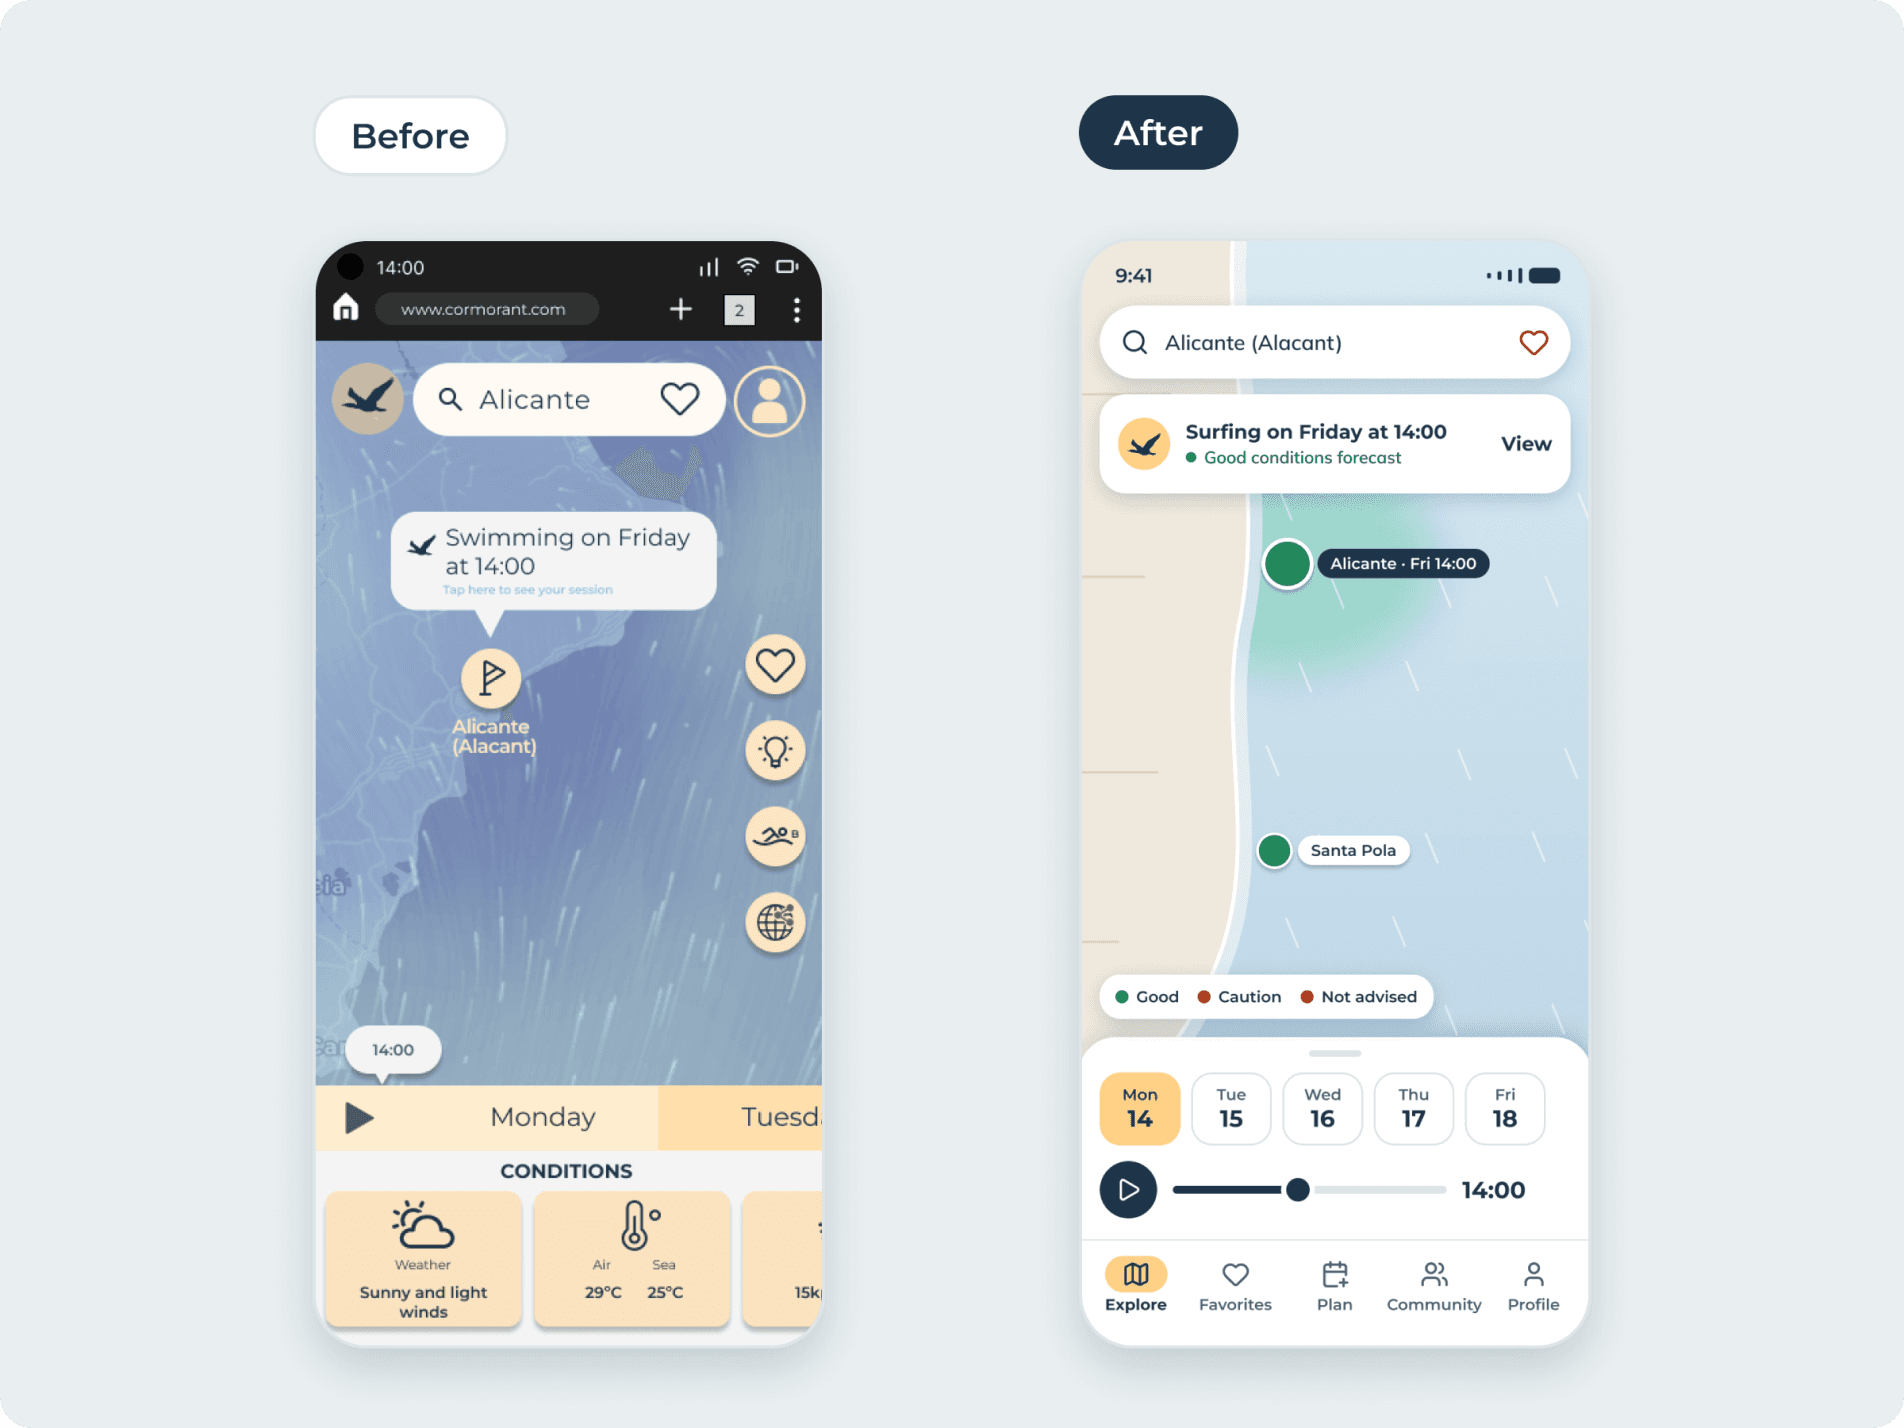
A planned session you can find
A banner on the map tells you what you planned and what the forecast says about it.
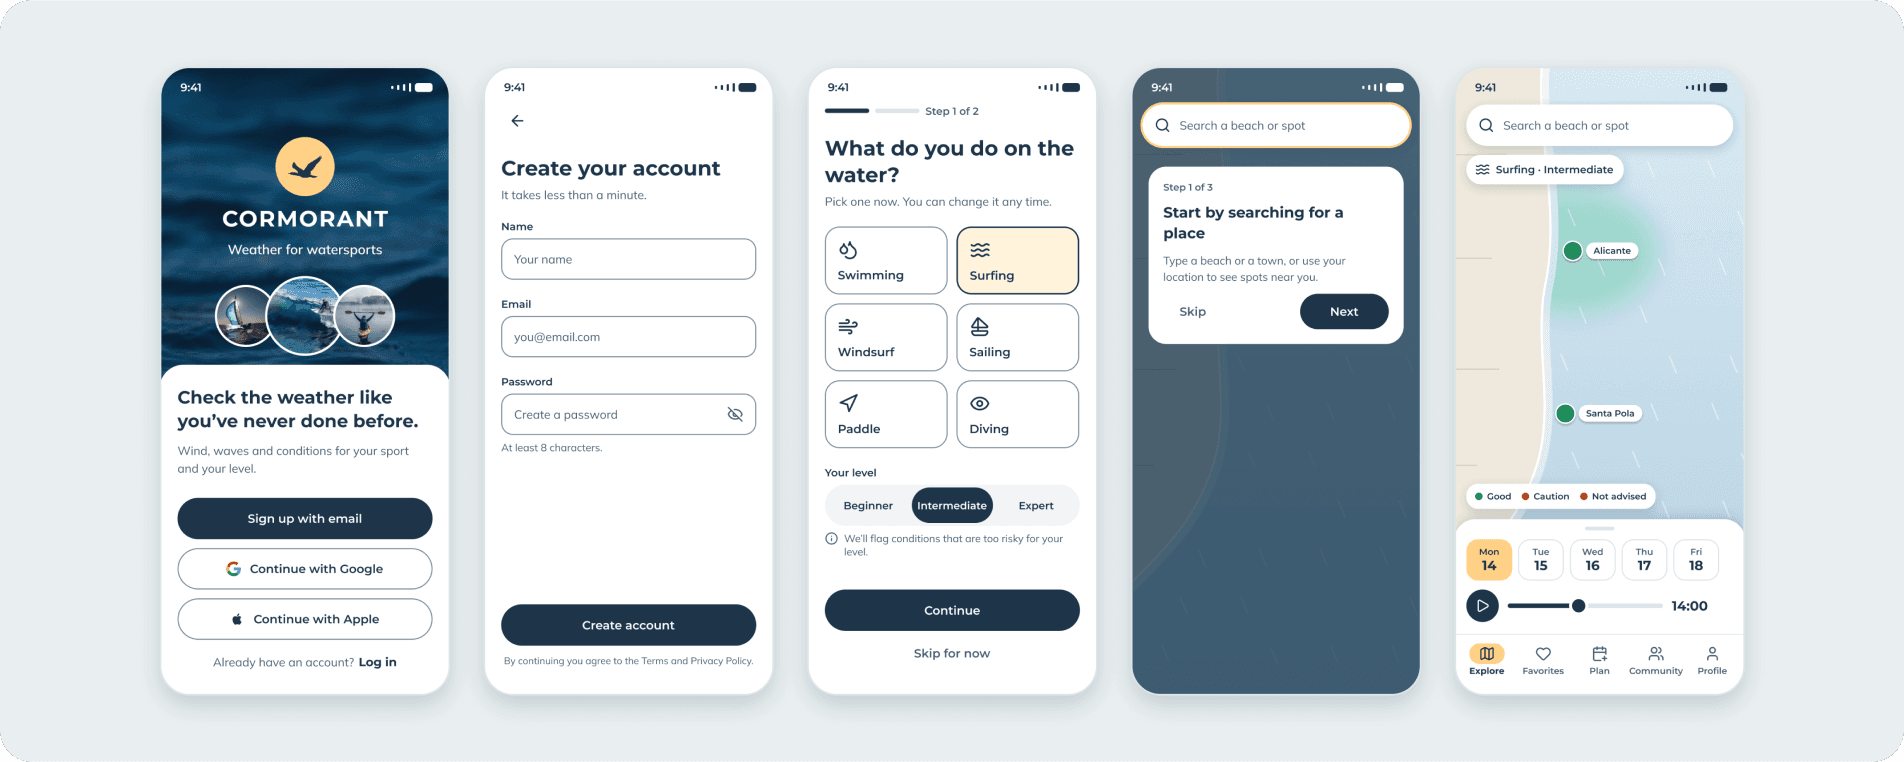
The redesigned flow (1/2)
Welcome, sign up, sport and level, onboarding and the home map.
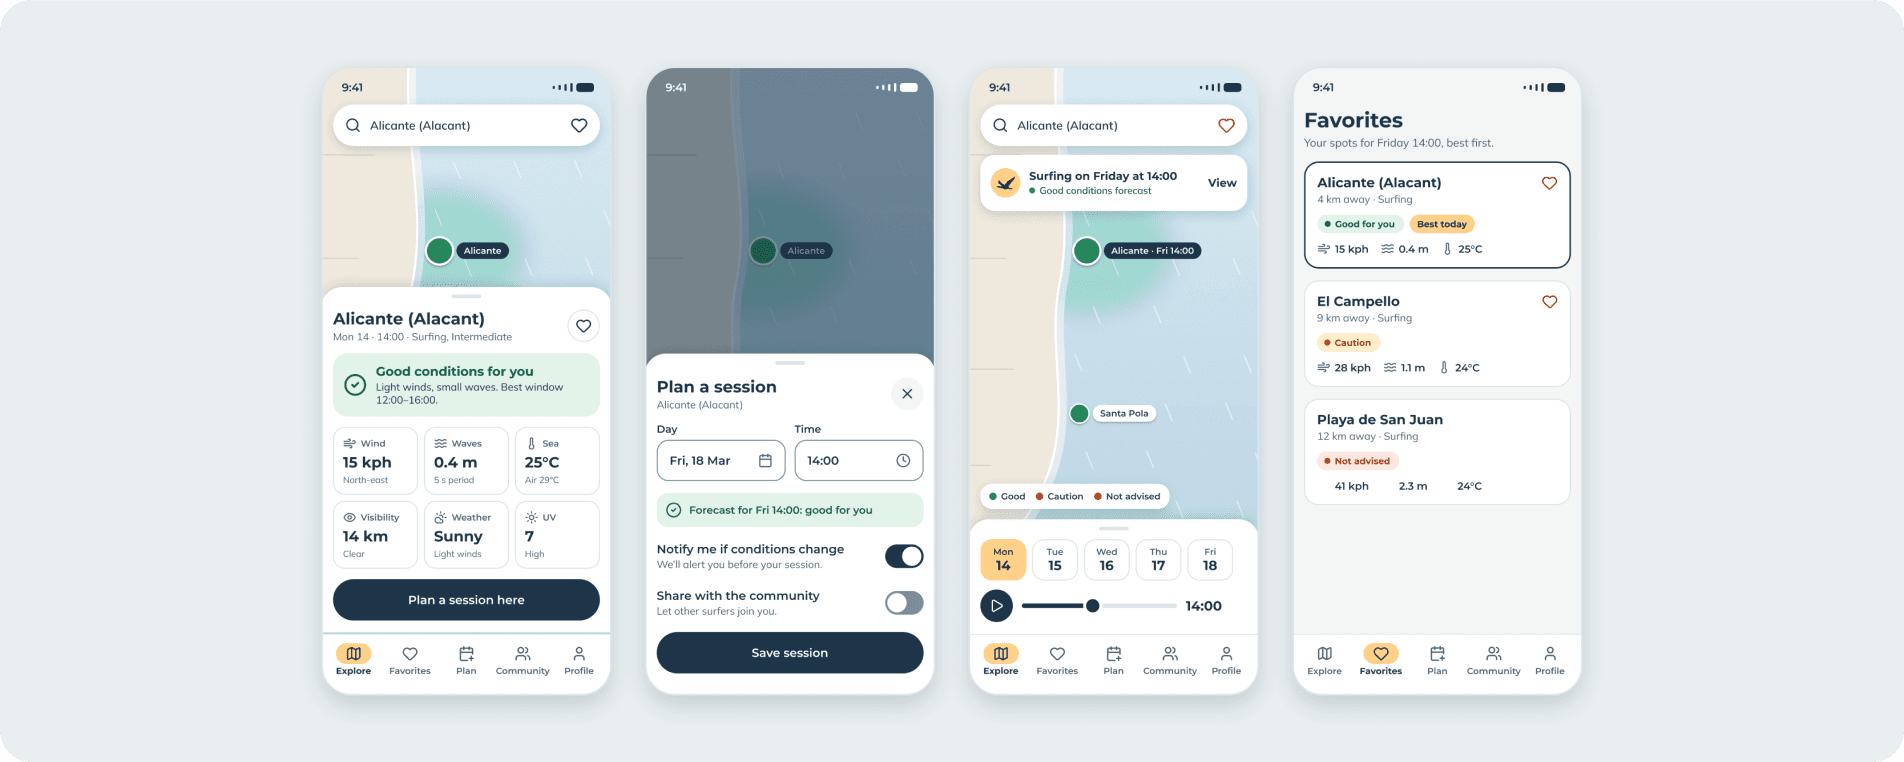
The redesigned flow (2/2)
Conditions, planning a session, the planned state and favorites to compare spots.
Reflection
What this project taught me
Cormorant was my first full UX process, from research to visual design. Revisiting it showed me how much a clear verdict, labelled navigation and readable text change a data-heavy product.
What held up
The research. The personas and journeys still point at the right problems, which is why the redesign could use them as its brief.
What I would do next
Test the redesigned screens with the same six testers, measure how fast they judge a spot, and check contrast and touch targets against WCAG AA.